


Facebook TOP Formation - Stock Market Crash Condition Signal Recorded
Stock-Markets / Stock Market Crash Mar 07, 2016 - 09:42 AM GMT

 This article presents an analysis of Facebook stock price. The novel mathematical technique adopted here is an exciting new way to analyze price movement.
- A new market timing technique has been developed by the author to identify significant top and bottom events in price movement.
- The new market timing tool shows that Facebook has a single 14 week window of opportunity from late January to late April for a significant top to be recorded in 2016.
- An additional mathematical model has been developed by the author to predict and identify stock market bubbles and crashes.
- The bubble identification model shows a current score of 96% for Facebook indicating that the top of the bubble has been reached or is close at hand, and a crash condition is now in effect.
- The model predicts that all bubbles must deflate back to the point where the bubble started to grow, which will mean a drop of at least 30% to 50% for Facebook over coming months.
- This technique was originally used to successfully identify the top of Apple Inc. and has also been used to propose a recent US stock market top in late Spring 2015.
ANALYSIS OF FACEBOOK STOCK PRICE
Various mathematical models have been used here to determine the future stock price of Facebook. All models have been developed independently by the author over the last ten to twelve years.
[A] Formation of a Bubble
A model has been developed by the author to predict, identify and classify stock market bubbles. The model works for all national and international stock market indexes (such as DJIA, S&P 500 and China's Shanghai index etc...) and also for individual stocks (such as Facebook, Apple Inc. etc...). In fact, the model has also been used successfully with the following commodities, Oil, Gold and Silver.
When the historic data is run through the model for Facebook, the model shows that Facebook has grown exponentially since its IPO in May 2012 and has formed a bubble. The model usually requires between 4 and 10 years (or more) of data to get the best results, so the fact that the Facebook IPO was almost 4 years ago means there is just enough data to run the model and get a successful output.
The following chart shows a long-term view of Facebook from its IPO in 2012 to the present time.
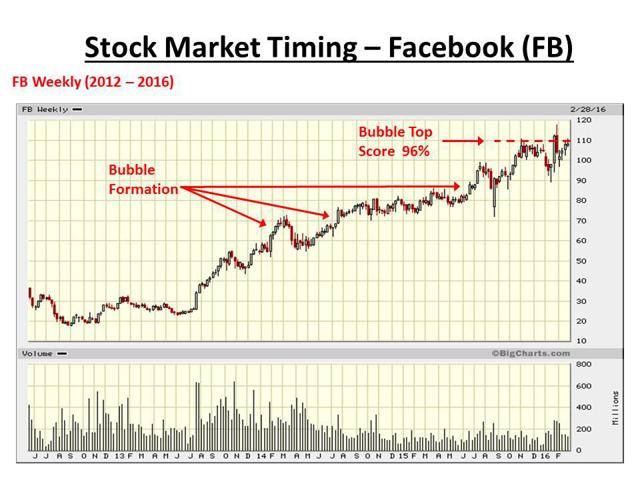
The model shows a score of 96% for Facebook indicating that the top of the bubble has been reached or is close, and a crash condition is now in effect. Typically, a score from the model of between 90% and 100%, indicates that the top of the bubble is near.
[B] Prediction of a TOP in Stock Price for Facebook
This next section covers the results from the market timing tool which predicts the likely window of opportunity for either the stock market top of an index to occur or for the top in price of an individual stock to occur.
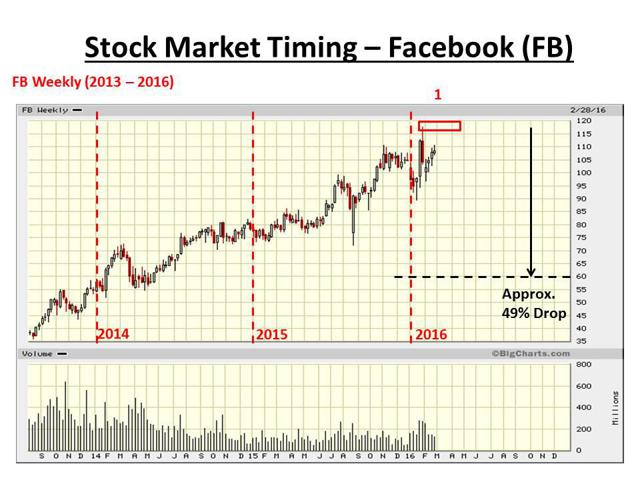
The following chart shows that the tool calculates a single 14 week window (red box) from Monday January 18, 2016 to Friday April 22, 2016 within which Facebook will most likely record a final top in price. At the time of writing this means that either the top has already been recorded the first week of February (February 1 to February 5) or the top will be recorded in the following 7 weeks (March 7 to April 22). Once the window closes on April 22, the price of Facebook shares will more than likely decline.
The model predicts that a fall of between 30% and 50% is expected before the bubble fully deflates. There is strong evidence from the model that Facebook will likely fall a minimum of 50% before a bottom forms. The chart below shows that the stock price of Facebook must go lower than the dashed black line which is a drop of 49% from the current all-time high.
TECHNIQUE USED PREVIOUSLY ON APPLE STOCK PRICE
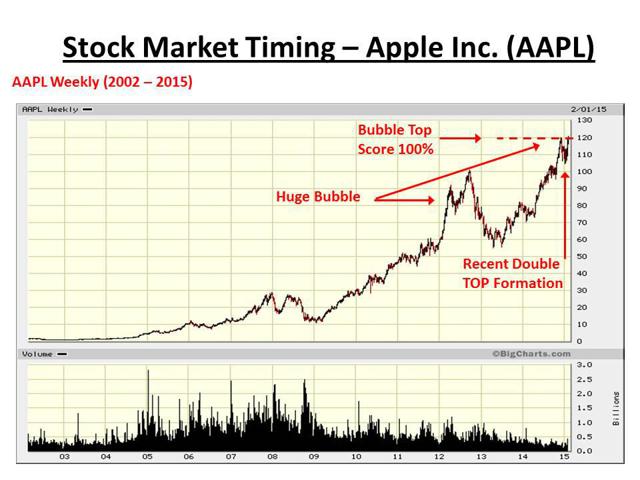
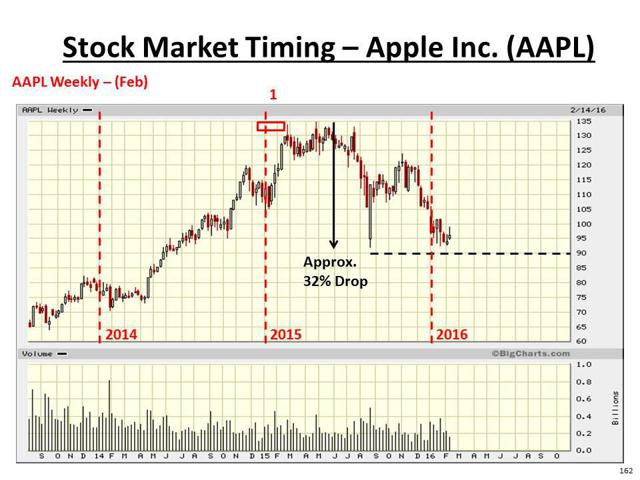
The following chart shows the bubble in Apple stock price and is from an article by the author published in February 2015, which can be found here. In this case, the model calculated a score of 100% for Apple (in early 2015) indicating that the top of the bubble has been reached or was close, and a crash condition is in effect at that time.
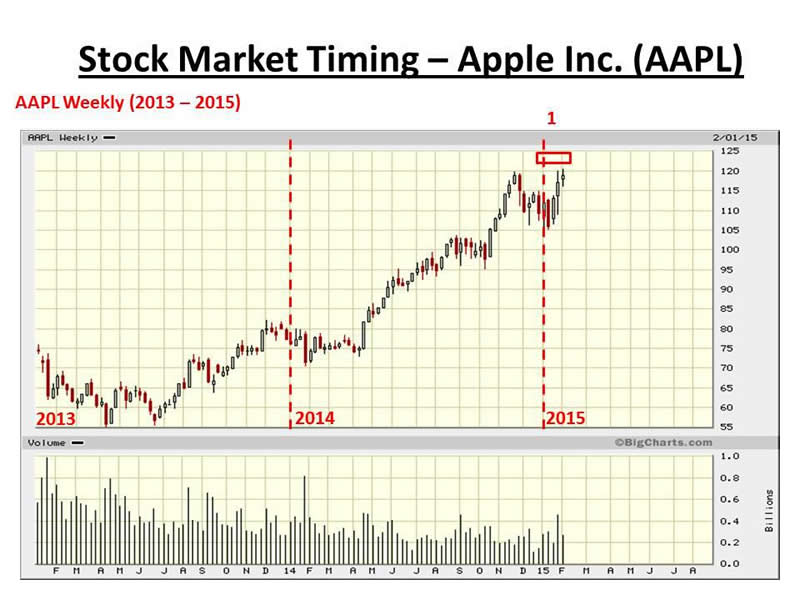
The following chart shows the 7 week window of opportunity (red box) for a top in Apple stock price, calculated by the market timing tool.
Once a price bubble forms (whether it be an equity index, an individual stock or a commodity) there will be a price drop of at least 30% to 50% and perhaps more. The bubble must fully deflate before the stock price can form a bottom and grow again, and full deflation will only occur when such a drop of at least 30% in price is recorded.
The following chart shows the bubble in Apple and the drop in price since its high during the early part of 2015. The price of Apple stock must fall below the dashed horizontal black line, as a minimum, before the bubble can fully deflate.
TECHNIQUE USED TO FIND A US STOCK MARKET TOP
This section describes the application of the technique to find a US stock market top with particular focus on the Dow Jones Industrial Average.
In mid-June 2014, the Dow Jones Industrial Average (DJIA) index signaled that a significant US market top was near, using a proprietary market timing model developed over the past decade. This DJIA market top signal only happens, on average, every 6 years, and has been recorded 21 times since the start of the DJIA index in 1885, over 130 years ago. The signal occurs at major US stock market tops, and was triggered in 1999 before the 2000 market top and again in 2007 before the most recent stock market top in October 2007.
The signal is 100% accurate, since all 21 instances of the signal have led to significant market drops. The signal also occurred prior to the 1929 US stock market crash during the Great Depression and prior to the 1987 stock market crash. There have been no false positives.
Analysis of the 21 previous occurrences of the signal provides the following statistics. The average delay between signal and DJIA stock market top is 39 weeks (about 9 months). The minimum DJIA drop after the signal was recorded is 12%. The average market drop is 33%. The worst market drop is 90% during the US Great Depression. So at the current time we can expect a drop in the DJIA of between 12% and 33%, perhaps more.
The market timing model cannot pin-point the exact moment that the market top will occur. For this reason, a second market timing tool, based upon the identification of non-linear price wave-forms, was built to provide a more accurate likelihood of when the market top would occur.
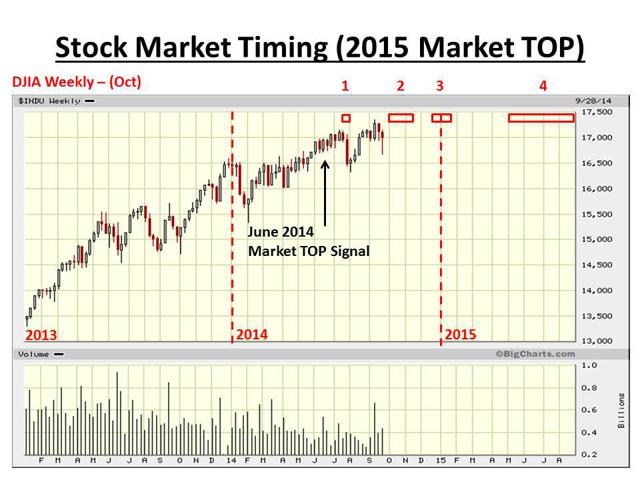
The new market timing tool, developed in July 2014, was used to determine a number of possible windows of opportunity to pin-point the timing for a significant stock market top. The first four windows calculated by the tool were :-
[1] A two week window in July 2014
[2] A seven week window from early Oct 2014 to mid-Nov 2014
[3] A four week window from mid-Dec 2014 to mid-Jan 2015
[4] A four month window covering May 2015 to Aug 2015
Below is a chart showing the four windows of opportunity (numbered red boxes) as they were first calculated, during the summer of 2014, shortly after the market top signal was recorded in mid-June 2014. Although not shown on this chart, a further window 5 was also calculated covering 3 months from March 2016 to May 2016. The US stock market has lost momentum during the second half of 2015 and first few months of 2016, and therefore it is not anticipated that a new DJIA all-time high will be recorded in window 5, but instead most likely a lower high.
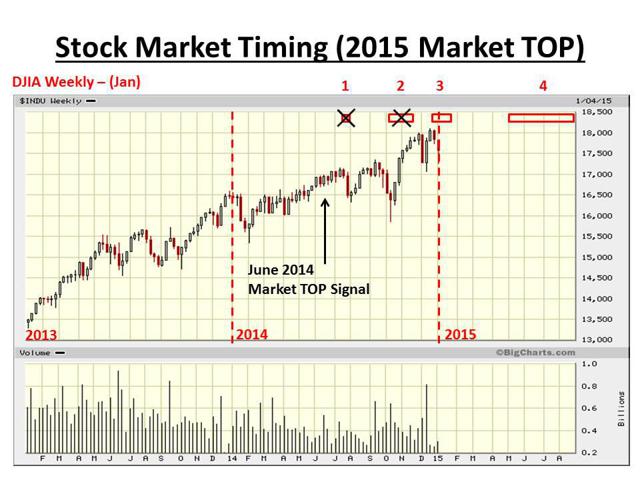
A significant high was recorded by the DJIA in December 2014, and this looked a likely candidate for a US stock market top. However, a particular pattern that normally forms at market tops for the DJIA was absent. The chart below shows the significant high recorded by the DJIA in late December 2014, in window 3 :-
In early March 2015, the DJIA index recorded a higher high so it was now more likely that the DJIA would continue to rise further into window 4 (May 2015 to August 2015).
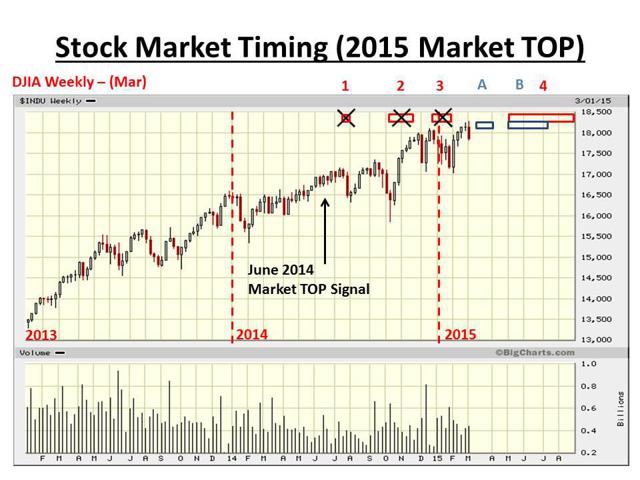
The issue with window 4 is that it is four months long, which is unusual for windows calculated by the timing tool. As a result of the large size of window 4 it was necessary to try and narrow down where in Window 4 the DJIA might likely form a new all-time high. In this case, the market timing tool was re-run using daily data (previously it was run using weekly data only) to gain better insight into the topping process.
The chart below shows two new windows A & B (shown in blue) calculated from the daily chart data. Window B overlaps with the first half of window 4 and indicated, at the time of calculation in March 2015, that the following May or June were likely targets for a DJIA US stock market top.
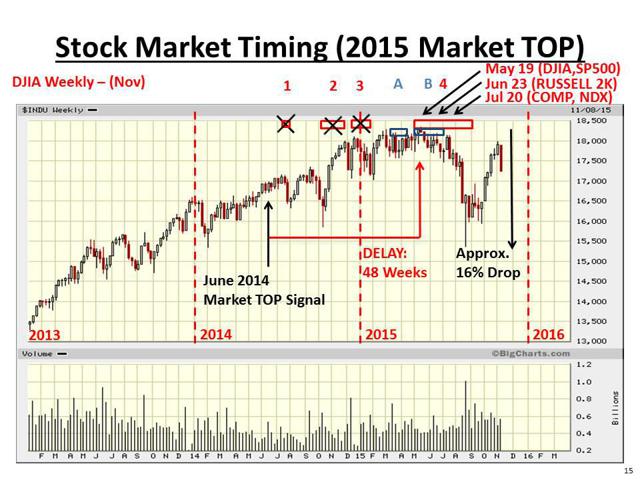
As we moved into Q2 2015, it was still possible for the market to record a higher high in window 4. This did indeed happen and the chart below shows the significant highs recorded by the major US stock market indexes in window 4. The DJIA and S&P500 indexes both recorded all-time closing highs on the same day in May. The Russell 2K recorded an all-time closing high in June and the NASDAQ Composite (COMP) and the NASDAQ 100 (NDX) both recorded new all-time closing highs on the same day in July. Note that only the NASDAQ 100 (NDX) went on to record a slightly higher all-time closing high more recently in early December 2015. The other four US indexes formed lasting all-time closing highs in window 4.
The chart below shows each of the key US stock market indexes topping out in window 4. The DJIA dropped 16% from its top, exceeding the prediction of 12%. Also the average delay after the stock market top signal up to the stock market top is 39 weeks (see section above), and in mid-2015 we see in the chart below a delay of 48 weeks, a little above the average of 39 weeks but nonetheless inline with expectation.
This work was initially presented in 2015 at the May General Meeting of the NYC Investor Meet-Up in Manhattan. A video of the meeting can be viewed on YouTube here.
Analysis of previous significant market tops and bottoms, over the past 130 years of the DJIA, indicates that 95% of previous market tops and bottoms have occurred during the calculated windows of opportunity, and that the remaining 5% have occurred between two closely aligned windows, rendering this technique very accurate.
CONCLUSIONS
The exponential rise in the stock price of Facebook stock has continued relentlessly since the low price of $17.55 was recorded shortly after its IPO in Spring of 2012. Since then, the over-stretched nature of the stock price has created a bubble which is inherently unstable and which will soon burst followed by a significant drop in price. An all-time intra-day high of $117.59 was recorded recently in February 2016. A new technique has been presented which predicts a window of opportunity for Facebook stock price to form a top.
The same technique was used to identify a top with Apple Inc. stock price a year ago in early 2015, and since that time Apple stock price has dropped over 30%.
Finally, the technique was used to identify a significant US stock market top with specific focus on the Dow Jones Industrial Average. We have yet to find out if we are truly in a multi-year bear market, however, significant evidence is now building to support the prediction that we are at the start of an extended bear market and that the US stock market will not form a bottom in price until after the middle of 2017.
Disclosure: I/we have no positions in any stocks mentioned, and no plans to initiate any positions within the next 72 hours.
By Dr. David J. Harris
Disclosure: The author has no positions in any stocks mentioned, and no plans to initiate any positions within the next 72 hours.
David Harris is an independent stock market investor and trader with an interest in modeling price movements in stock markets. In particular, David has spent the last ten years developing mathematical models to identify market tops and market bottoms and more recently a model that identifies bubbles in national stock market indices and individual stocks. Trained originally as an Electronic Engineer, David has a First Class Honors Degree in Electronic and Electrical Engineering from Leeds University, UK and a PhD in Adaptive Control Algorithms, also from Leeds University. David has worked as a Senior IT Manager in the City of London and more recently in New York City for a variety of Investment Banks, including NatWest ...More Markets, Bankers Trust, Deutsche Bank, Bank of Bermuda and HSBC Bank.
© 2016 Copyright Dr. David J Harris - All Rights Reserved Disclaimer: The above is a matter of opinion provided for general information purposes only and is not intended as investment advice. Information and analysis above are derived from sources and utilising methods believed to be reliable, but we cannot accept responsibility for any losses you may incur as a result of this analysis. Individuals should consult with their personal financial advisors.
© 2005-2022 http://www.MarketOracle.co.uk - The Market Oracle is a FREE Daily Financial Markets Analysis & Forecasting online publication.