


Trump vs. the Stock Market
Stock-Markets / Stock Markets 2016 Mar 08, 2016 - 06:04 PM GMTBy: Clif_Droke

 The broad equities market has gotten a respite from the selling pressure which plagued it for the last few months. Some of this can be attributed to the Kress cycle “echoes” which we reviewed earlier this year. The echoes, which are based on the 6-year, 10-year, and 30-year cycles, suggested that stocks could experience a rally in the March-April time frame based on past rhythms. To date that expectation has materialized as traders cover short positions that were built up to excessive proportions in prior months.
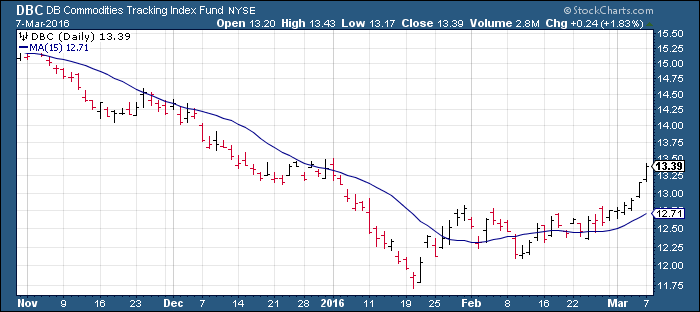
Adding to the upside in equities lately has been a long overdue relief rally in commodities and natural resource stocks. Much of the selling pressure plaguing stocks in recent months was a spillover of commodity market weakness. With commodities now on the upswing, stocks are getting a major reprieve.
The following chart shows the PowerShares DB Commodity Index Tracking Fund (DBC), which largely corresponds to the CRB commodity price index. The greater the distance DBC puts between its January low, the better it will bode for the near-term stock market outlook. A continued rally in commodities would also signal to investors that the global market crisis is in a condition of stasis. This in turn should serve to increase risk appetite among investors.
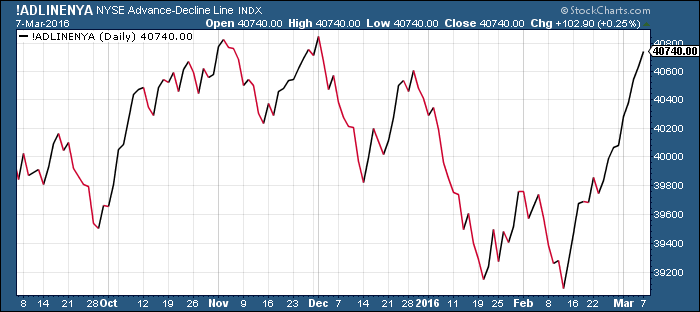
To date, all the classic signs of an interim bottom are in place. The NYSE advance-decline (A-D) line is outperforming the NYSE Composite Index. NYSE advance-decline volume is also confirming the rallies. Most importantly, the number of stocks making daily new 52-week lows on the NYSE has drastically fallen under 40 since last month. This tells us that the market’s internal health is improving and that internal selling pressure is no longer a major problem.
Moreover, the short-term and intermediate-term rate of change (momentum) of that new highs-new lows have dramatically improved in recent weeks. Because the number of stocks making new lows has dropped significantly while the overall hi-lo differential has been positive, the momentum of the new highs-new lows has finally turned up after being down for months. This indicator has been an invaluable aid to confirming that the near-term path of least resistance for stocks since last month is up.
Arguably the biggest boost to equities in the near term has been the upward turn in the crude oil price. Oil is widely regarded as the most important indicator for the overall health of the global economy. Plunging prices in the energy market in past months created a deflationary scare among investors and stoked fears of a global economic recession. Those fears aren’t completely without foundation, but for now another proverbial bullet has been dodged as the oil price enjoys a much-needed relief rally.
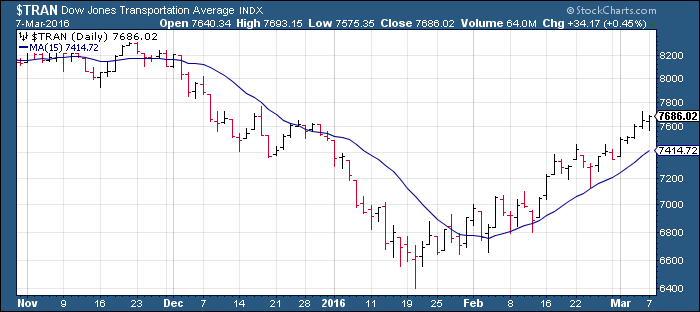
Finally, I would point out the bullish nature of the Dow Jones Transportation Average (DJTA) which has also been a strong leading indicator for the broad market – particularly the Industrials. The leadership of the DJTA has been bullish from a Dow Theory perspective, especially since the Transports led the way lower for the Industrials last year.
As the following graph shows, DJTA is about to test an important chart resistance at the 7,800 area. A breakout above this level would pave the way for another leg higher in the major indices from a Dow Theory standpoint.
In the previous commentary I noted that the bulls would likely do everything in their power to protect the 9,000 level in the NYSE Composite Index (NYA) from being violated. The NYA found support above 9,000 and has benefited from a vigorous short-covering rally since as the implications of a breakdown below this key technical level are simply too severe to happen at this time.
One reason for the premature nature of a break under 9,000 is the spillover impact such a breakdown would have on the global financial economy. The upcoming presidential election is another factor. Surpassing worries over the global economy lately has been the hysteria over the U.S. presidential race. Investors have been polarized over the leading candidates in both parties, particularly over the primary victories of a certain billionaire candidate. My policy of not commenting on politics forbids me from injecting an opinion, but I’d like to share at least one insight.
The current Republican frontrunner has undeniably garnered a rather sizable protest vote among disenchanted voters. In many ways Mr. Trump’s candidacy recalls the populist uprisings of past elections which saw the short-term success of candidates William Jennings Bryan, George Wallace and Ross Perot. In each of these cases an uncertain economic outlook led to the rise of dark horse populist frontrunners.
In the final analysis, however, America’s inveterate tendency to vote for the most electable candidate (based on the conventions of the day) won out and the extremism that characterized the earlier stages of the elections was ultimately discarded. Observers should keep that in mind as the country’s collective passions rise with temperatures this spring.
It also would appear that Mr. Trump’s ascension has been tied, to an extent, to the economic and equity market sluggishness of the last year. Indeed, his biggest victories to date have occurred when stock and commodity prices have been on the downswing and the market has been internally weak. But what happens if the market rebound gains traction and continues beyond March-April seasonal strength? Could this not fuel a resurgence in the prospects of his closest rival for the nomination? If nothing else it would erode deflation fears among investors, which in turn would defuse the urgency of the protest vote. While some may scoff at this unorthodox association, pundits would do well to monitor the correlation in the weeks and months ahead.
Mastering Moving Averages
The moving average is one of the most versatile of all trading tools and should be a part of every investor's arsenal. Far more than a simple trend line, it's also a dynamic momentum indicator as well as a means of identifying support and resistance across variable time frames. It can also be used in place of an overbought/oversold oscillator when used in relationship to the price of the stock or ETF you're trading in.
In my latest book, Mastering Moving Averages, I remove the mystique behind stock and ETF trading and reveal a simple and reliable system that allows retail traders to profit from both up and down moves in the market. The trading techniques discussed in the book have been carefully calibrated to match today's fast-moving and sometimes volatile market environment. If you're interested in moving average trading techniques, you'll want to read this book.
Order today and receive an autographed copy along with a copy of the book, The Best Strategies for Momentum Traders. Your order also includes a FREE 1-month trial subscription to the Momentum Strategies Report newsletter: http://www.clifdroke.com/books/masteringma.html
By Clif Droke
www.clifdroke.com
Clif Droke is the editor of the daily Gold & Silver Stock Report. Published daily since 2002, the report provides forecasts and analysis of the leading gold, silver, uranium and energy stocks from a short-term technical standpoint. He is also the author of numerous books, including 'How to Read Chart Patterns for Greater Profits.' For more information visit www.clifdroke.com
Clif Droke Archive |
© 2005-2022 http://www.MarketOracle.co.uk - The Market Oracle is a FREE Daily Financial Markets Analysis & Forecasting online publication.