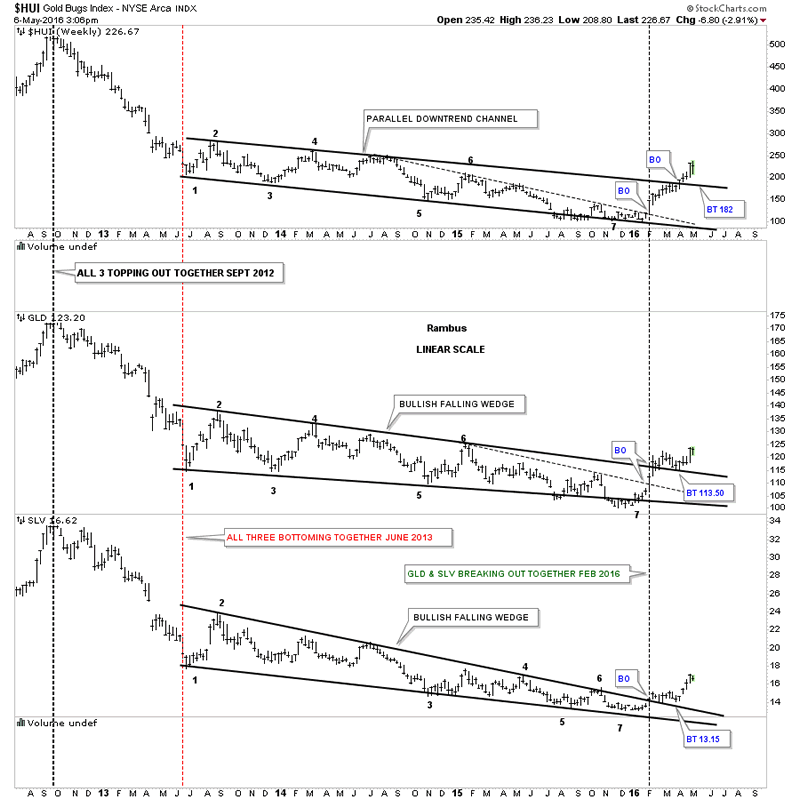
Precious Metals Complex Combo Chart...
Commodities / Gold and Silver 2016 May 07, 2016 - 06:45 PM GMTBelow is a long term weekly chart we've been following which shows the breakouts and backtesting that have been going on for several months with gld and slv, and just 5 weeks or so for the HUI. This big picture look from 35,000 feet shows how infant this new bull market is right now. It was basically born back in January of this year and is just opening its eyes. What we want to see now is a higher high in the coming days and weeks.
HUI Gold Bugs Index Weekly Chart

All the best
Gary (for Rambus Chartology)
FREE TRIAL - http://rambus1.com/?page_id=10
© 2016 Copyright Rambus- All Rights Reserved
Disclaimer: The above is a matter of opinion provided for general information purposes only and is not intended as investment advice. Information and analysis above are derived from sources and utilising methods believed to be reliable, but we cannot accept responsibility for any losses you may incur as a result of this analysis. Individuals should consult with their personal financial advisors.
© 2005-2022 http://www.MarketOracle.co.uk - The Market Oracle is a FREE Daily Financial Markets Analysis & Forecasting online publication.


