


The Gold Chart That Has Central Banks Extremely Worried
Commodities / Gold and Silver 2016 May 20, 2016 - 07:17 PM GMTBy: Steve_St_Angelo

 This gold chart should have Central Banks extremely worried. Why? Because the change in physical gold and Central Bank demand since the first crash of the U.S. and global markets in 2008 is literally off the charts.
I advise precious metals investors not to focus on the short-term gold price movement, rather they should concentrate on the long-term trend changes. This is where the ultimate payoff will be by investing in gold. Now, I say “INVESTING”, in gold because that is what we are doing.
Many analysts such as Jim Rickards don’t believe that gold is an investment. Mr. Rickards looks at gold as money or insurance on the collapse of the U.S. Dollar and fiat monetary system. However, I look at gold as an investment due to the collapse of U.S. and World energy production.
While I have been a broken record on this, many investors still don’t understand what I am trying to get across here. Gold and silver are more than money today because of the 40+ year funneling of investors funds away from REAL ASSETS and into PAPER CLAIMS on future economic activity. Thus, 99% of investors have sent their money into the largest Ponzi Scheme in history.
Jim Rickards fails to understand this principle because he doesn’t’ factor in energy into the equation. I find most precious metals analysts do the same thing as they forecast the future gold price based on how much fiat currency (or money supply) is outstanding.
Folks…. it won’t matter how much money is floating around in the future as energy production plummets. Who cares if there are trillions of M2 or M3 outstanding, when we won’t have the energy to continue running a system that only can function by a growing energy supply. To base the future value of gold on outstanding currency is FOLLY.
Which is precisely why I label gold and silver as INVESTMENTS. Their values will surge as most paper and physical asset values collapse. The revaluation of gold and silver will occur well beyond the collapse of fiat money… they will also rise in value due to the disintegration of most physical and paper assets. This is well beyond the scope of money or insurance.
The Gold Chart That Has Central Banks Extremely Worried
 Before I get into the details of this gold chart, I would like to let my readers and followers know about my recent interview on TFmetals Report. I sat down with Mr Ferguson (Craig) and discussed a lot of the Gold Market in a live webinar with many of his subscribers. He has now made the interview public:
You can either click on the image and go to the TFmetals Report website and listen to the interview, or you can click on the link below:
TFmetals Report A2A With Stephen St. Angelo Of The SRSrocco Report
Okay, here is the gold chart that Central Banks should be worried about:
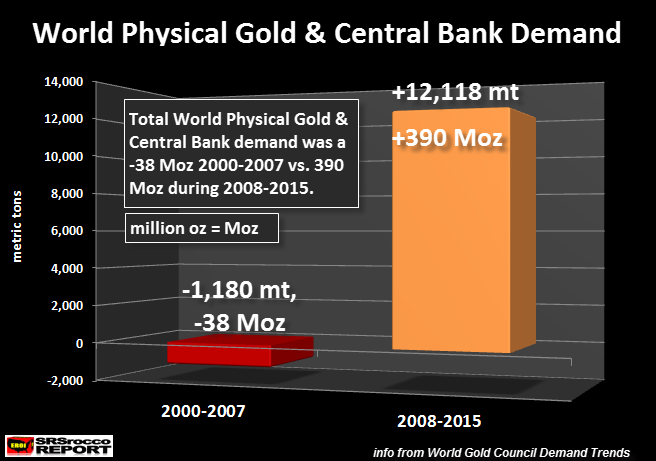
This chart represents the change of physical Gold Bar & Coin demand including Central Bank net purchases. Before the first collapse of the U.S. and Global markets in 2008, Central Banks dumped approximately 3,956 metric tons (mt) of gold on the market. I have figures for 2002-2015 from the World Gold Council, but I estimated a total of 800 mt for 2000 and 2001. This is based on data from the chart in the article, Germany Stops Selling Gold, Eurozone Sales Fall To Zero.
If we subtract the Central Bank dumping of 3,956 mt of gold from total Gold Bar & Coin demand of 2,776 mt, we get a net negative 1,180 mt during the 2000-2007 period. Thus, Central Bank sales added 1,180 mt more gold supply than was consumed by investor physical gold purchases.
NOTE: These figures do not include Gold ETF or similar product demand. I decided to exclude this data as it is impossible to know if the gold held by these Electronic Traded Funds or similar products is not oversubscribed to one or more owners. We know that when someone purchases either physical Bar & Coin or Central Bank gold.. there is more of a guarantee that this gold is likely unencumbered.
However, this situation changed drastically since 2008. Even though Central Banks still sold 235 mt of gold in 2008 and 34 mt in 2009, this changed to net purchases in 2009. If we add up all Central Bank gold sales and purchases from 2008 to 2015, it turned out to be 2,657 mt.
While this was a big change from Central Bank net sales of 3,956 mt (2000-2007), the real winner was the increase of Gold Bar & Coin demand. Gold Bar & Coin demand surged to 9,461 mt from 2008-2015 versus 2,657 mt during 2000-2007. Thus, physical gold investment and Central Bank demand totaled a whopping 12,118 mt from 2008-2015. This equals a massive 390 million oz (Moz) for total physical gold and Central Bank demand since 2008 compared to a net supply of 38 Moz in the first period.
Investors need to really take a good look at the chart. What a change in demand from 38 Moz of net supply from 2000-2007 versus net demand of 390 Moz during the 2008-2015 period. To get more understanding of the changing gold trends, I discuss this in my interview on TFmetals Report which I highly recommend listening to at the link above.
Lastly, now that Mainstream investors piled into Gold ETF’s during the first quarter of 2016, this could really upset the market going forward. Currently, Gold Bar & Coin demand and Central Bank purchases are averaging about 1,600 mt annually for the past several years. This could easily jump to 2,000 mt once the U.S. and global stock markets start to crash as investors move into the SAFETY TRADE (of gold).
If western Gold ETF demand really starts to surge, this could cause serious trouble for Central Banks as availability of gold supply tightens. Global Gold ETF demand hit a high of 645 mt in 2009 as the U.S. and world stock markets crashed to their lows. However, we already saw a huge 364 mt inflow of Gold ETF’s during the first quarter of 2016… and the DOW ONLY FELL 2,000 points. What happens when the market really tanks??
If Gold ETF demand jumps to 1,000 mt along with Gold Bar-Coin demand and Central bank purchases totaling 2,000 mt, this would equal 3,000 mt or nearly 75% of total supply.
At some point, demand for gold will overwhelm supply causing the price to skyrocket. This isn’t a matter of if, but a matter of when. So, the more Central Banks screw around with monetary policy and as the broader stock markets continue their collapse, the closer we are to seeing record gold prices.
Lastly, if you haven’t checked out our new PRECIOUS METALS INVESTING page, I highly recommend you do.
Please check back for updates at the SRSrocco Report and you can also follow us at Twitter:
![]()
2016 Copyright Steve St .Angelo - All Rights Reserved Disclaimer: The above is a matter of opinion provided for general information purposes only and is not intended as investment advice. Information and analysis above are derived from sources and utilising methods believed to be reliable, but we cannot accept responsibility for any losses you may incur as a result of this analysis. Individuals should consult with their personal financial advisors.
© 2005-2022 http://www.MarketOracle.co.uk - The Market Oracle is a FREE Daily Financial Markets Analysis & Forecasting online publication.