


Stock Market Spy Decision Imminent!
Stock-Markets / Stock Markets 2016 Jun 06, 2016 - 08:35 AM GMTBy: Submissions

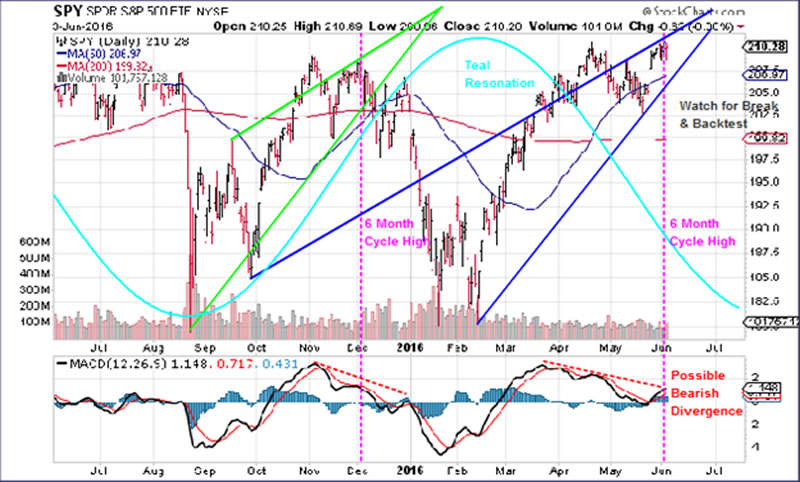
Joseph VanDerveer writes: Below is a Daily Chart of SPY. I would like to point out a few observations, starting with the two rising wedges that take a little imagination but bare with me.
Watch the lower trendline going forward specially when we are passing a potential 6 month cycle top noted on the chart with two dashed vertical lines.
Along with that 6 month cycle high, take notice of the teal resonation, you can’t get much better for some of the textbook cycles that need watching.
These are just 2 cycles labeled just to give you a taste, there are at least a dozen more here that I will leave out for now.
Next take a look at the MACD indicator at the bottom, currently sporting a bearish divergence but still above the zero line.
This chart should give two options here, one bullish and one bearish. Does not get much better than this. One further note, the 50 day and 200 day moving average can’t even compare to this type of analysis.
Always keep an open mind and prepare for the worst in any trading decision you make.
Joseph VanDerveer is the Chief Technical Analyst with 8 years experience in the trenches trading the markets with a brand new website and service at www.doubleplayoptions.com
© 2016 Copyright Joseph VanDerveer - All Rights Reserved
Disclaimer: The above is a matter of opinion provided for general information purposes only and is not intended as investment advice. Information and analysis above are derived from sources and utilising methods believed to be reliable, but we cannot accept responsibility for any losses you may incur as a result of this analysis. Individuals should consult with their personal financial advisors.
© 2005-2022 http://www.MarketOracle.co.uk - The Market Oracle is a FREE Daily Financial Markets Analysis & Forecasting online publication.