


This Suggests That Silver Will Soon Spike Significantly Higher
Commodities / Gold and Silver 2016 Aug 10, 2016 - 04:50 PM GMTBy: Hubert_Moolman

 The silver price and the US Dollar/South African Rand exchange rate (USD/ZAR) have a very interesting relationship that goes back a long way.
Basically, in the long run, the two move in opposite directions. When the USD/ZAR rate is moving up, then the silver price is moving down, and vice versa. Furthermore, when the USS/ZAR rate is making a top, then a bottom in silver is normally very close (before or after the USD/ZAR peak).
Due to the nature of this relationship, I find that the USD/ZAR chart is often a leading indicator for a silver bottom as well as a silver rally.
Then – It signalled the bottom
Earlier this year, the USD/ZAR chart signalled the fact that the December 2015 low in silver was actually the bottom for the 5-year decline. This, from my February 2016 premium service (in italics):
Below, is a comparison showing the relationship between USD/ZAR peaks and silver bottoms:
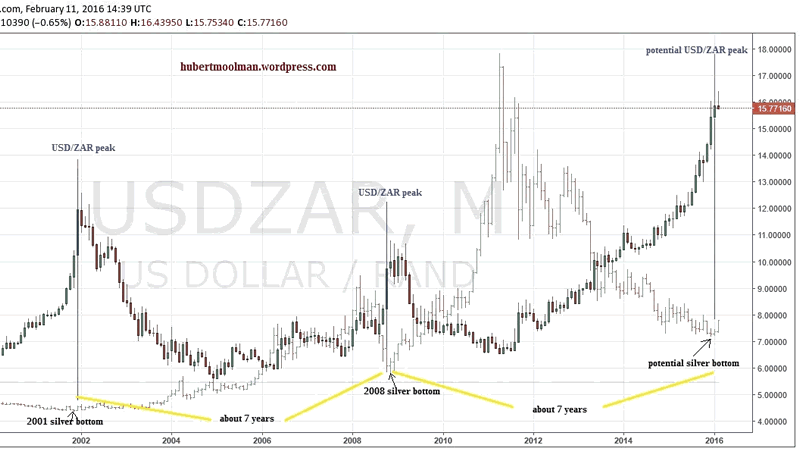
On the chart (from tradingview.com), I have drawn blue lines at the 2001, 2008 and potential Jan 2016 USD/ZAR peaks. One can see how close to these peaks the 2001, 2008 and potential Dec 2015 silver bottoms were.
Given, the look of the Jan 2016 candlestick; it is likely that the USD/ZAR chart has peaked.
If it has indeed peaked, then there is a very strong likelihood that the December 2015 bottom in silver is actually the bottom since the 2011 peak. It is interesting to note that there is a 7-year interval between the silver bottoms.
Now - it signals a rally similar to that of August 2010 – April 2011
Below is a USD/ZAR chart from 2004 to 2016 (from tradingview.com):
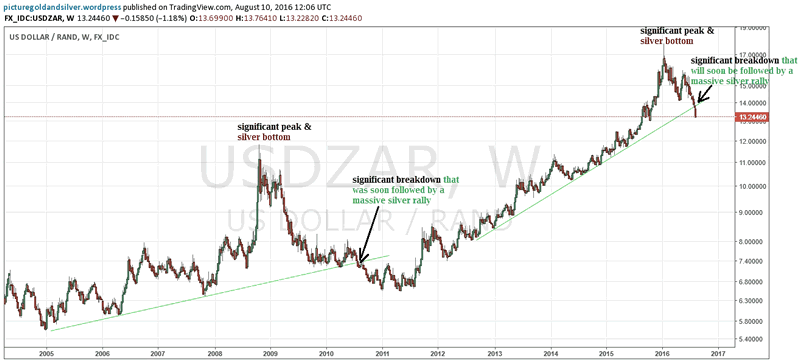
On the chart, I have marked two significant peaks (October 2008 and January 2016). Silver also made a significant bottom around the same time during both peaks. The USD/ZAR had a significant breakdown in July of 2010 as indicated. This was followed by a significant silver rally that really took off around the end of August 2010.
The USD/ZAR chart recently had a similar breakdown as indicated. This tells me that silver will soon spike significantly higher. This fractal analysis of a previous article also suggests that silver is close to a significant spike.
For more of this kind of analysis on silver and gold, you are welcome to subscribe to my premium service. I have also recently completed a Long-term Silver Fractal Analysis Report .
Warm regards
Hubert
“And it shall come to pass, that whosoever shall call on the name of the Lord shall be saved”
http://hubertmoolman.wordpress.com/
You can email any comments to hubert@hgmandassociates.co.za
© 2016 Copyright Hubert Moolman - All Rights Reserved
Disclaimer: The above is a matter of opinion provided for general information purposes only and is not intended as investment advice. Information and analysis above are derived from sources and utilising methods believed to be reliable, but we cannot accept responsibility for any losses you may incur as a result of this analysis. Individuals should consult with their personal financial advisors.
© 2005-2022 http://www.MarketOracle.co.uk - The Market Oracle is a FREE Daily Financial Markets Analysis & Forecasting online publication.