


Here Comes The Stock Market Air Pocket!
Stock-Markets / Stock Markets 2016 Aug 12, 2016 - 11:42 AM GMTBy: Brad_Gudgeon

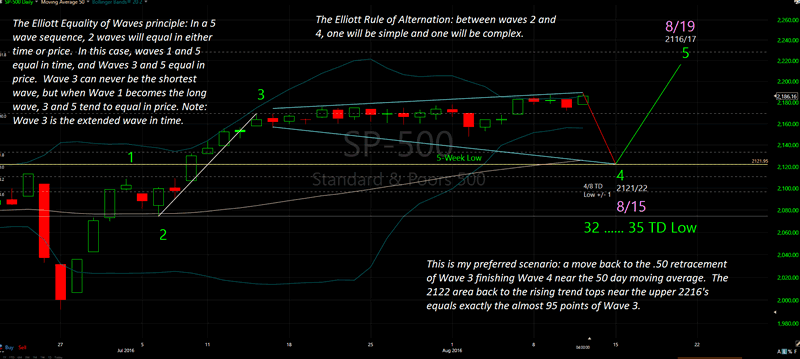
 The astro/cycle/wave read between now and August 15th looks for a quick abrupt air pocket of close to 3% in the SPX. At first, I was looking for a Wave 4 pullback to 2132/33 by late Friday, but upon re-examination, I believe it will be more in the order of 2122 by Monday. Normally, lows in the market don’t go past the moon in Sagittarius (late Thursday –Saturday), but I have to remind myself of Uranus Retrograde: expect the unexpected.
What’s exciting about this wave count is: it is truly a "5 wave count" C Wave. I have not seen a true 5 wave sequence since the year 2000. Many so called E-Wavers have not read R.N. Elliott’s original works and end up forcing 3 wave sequences into 5 waves. There are rules that MUST be abided by in order to properly ascertain the correct count.
The chart below goes through some of those rules:
SPX Preferred Elliott Wave Count Daily Chart
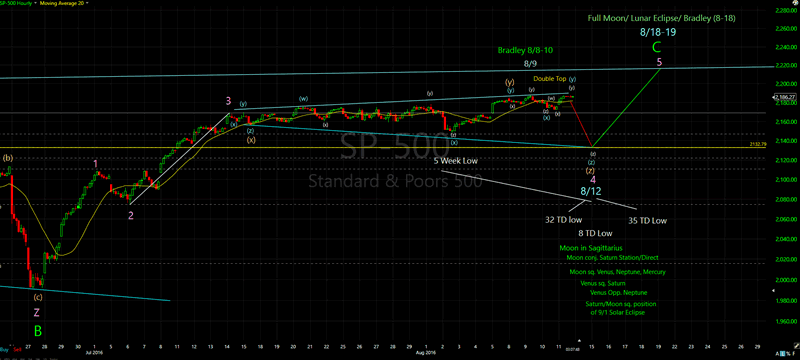
This second chart is an hourly chart of the SPX supposing a target of 2132/33 by late Friday with all the minute e-wave counts (I could have gone deeper):
SPX Preferred Elliott Wave Count Hourly Chart
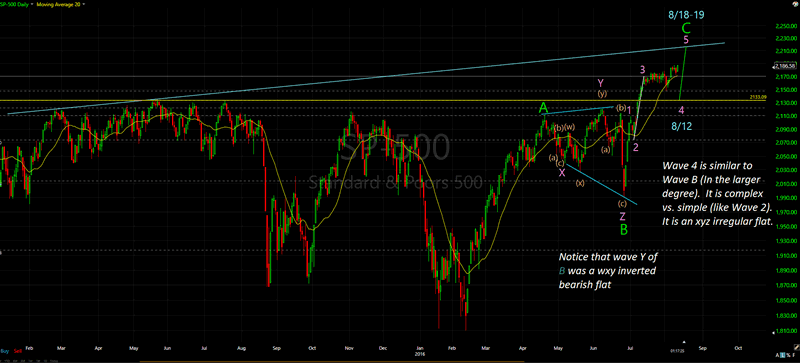
This third chart shows the same target of 2132/33 with a larger picture of where we are (near THE top for the year):
SPX Daily Chart
While 2132/33 or even 2122 are possible by the end of day Friday, it is highly unlikely. My best guess is a maximum of 2144/45 Friday and 2121/22 by late Monday.
Once THE top is put in (late next week), I believe we begin an ABC type drop into late November that could take us down to the 1700 level or even lower (1635/40?). Wave A should take us down into the September 8th or 9th timeframe and should be the shortest (or equal) wave of the sequence. I believe the initial A Wave decline could be about a 13% before we go into a sideways bear flag into late October or early November.
No matter what the FED may do, I don’t believe that they can hold up the stock market enough to try and put Hillary in the White House. Good news for Trump supporters?
Brad Gudgeon
Editor of The BluStar Market Timer
The BluStar Market Timer was rated #1 in the world by Timer Trac in 2014, competing with over 1600 market timers. This occurred despite what the author considered a very difficult year for him. Brad Gudgeon, editor and author of the BluStar Market Timer, is a market veteran of over 30 years. The website is www.blustarmarkettimer.info To view the details more clearly, you may visit our free chart look at www.blustarcharts.weebly.com.
Copyright 2016, BluStar Market Timer. All rights reserved.
Disclaimer: The above information is not intended as investment advice. Market timers can and do make mistakes. The above analysis is believed to be reliable, but we cannot be responsible for losses should they occur as a result of using this information. This article is intended for educational purposes only. Past performance is never a guarantee of future performance.
Brad Gudgeon Archive |
© 2005-2022 http://www.MarketOracle.co.uk - The Market Oracle is a FREE Daily Financial Markets Analysis & Forecasting online publication.