Broadening Top Megaphone Pattern Predicted Stock Market Crash
Stock-Markets / Stocks Bear Market Jul 25, 2008 - 06:52 PM GMT “The Jaws of Death” - The following chart was shown regularly throughout 2007, as we made the point that stocks, specifically the Dow Industrials, had traced out a huge, ominous, major Broadening Top pattern which suggested a long and sharp plunge would follow.
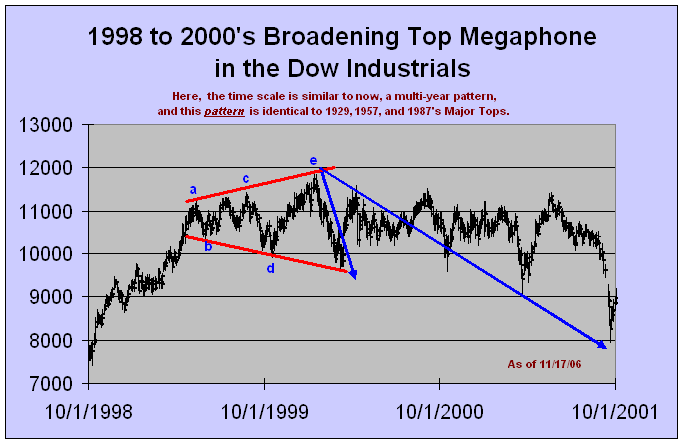
Here is what we said in the August 2007 expanded weekend issue: “We researched and discovered that almost all the major stock market tops of the past century were marked by a Broadening Top pattern . This pattern, also know as a Megaphone , which also looks like a set of jaws, is uniquely characterized by two mirroring boundary lines. The top boundary line is ascending; the bottom boundary line is descending.
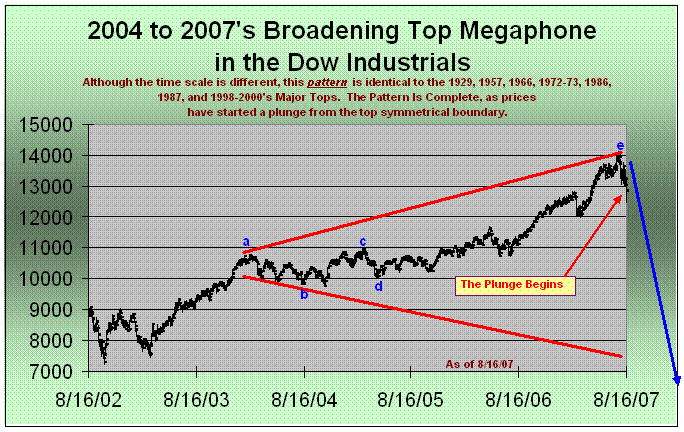
What is amazing is that each boundary line has the same slope , one rising, the other falling. We have the exact same pattern as these 7 other occurrences right now in the Dow Industrials . While the positioning of points c and d vary slightly in each of the 8 patterns, what seems to matter most is the Megaphone boundary lines. That is the key characteristic. Points a, b, and e are positioned similarly in all 8 patterns.
“The lines are formed by simply drawing trend-lines connecting the peaks and connecting the troughs. Each line is formed by connecting at least 2 points . In other words, neither boundary line is manufactured by a biased analyst. Rather, it is formed where the market decided to top and bottom along its path to a major top. What are the odds that the slopes of these trend-lines would be exactly the same? What are the odds that seven of the greatest market tops of the past century in the Dow Industrials would bear the markings of this pattern? This is not random. This is a normal pattern of distribution and market buying/selling psychology that naturally leads to major tops, and subsequent declines ranging from 10 percent to 40 percent over a period from a month to 11 months.
“These patterns were found in 1929, 1957, 1965-66, 1972-73, 1986, 1987, 1998-2000, and now 2004-2007. These were the big-boy tops of the past century. The Jaws of Death pattern. The bad news: This pattern tells us more downside is coming.”
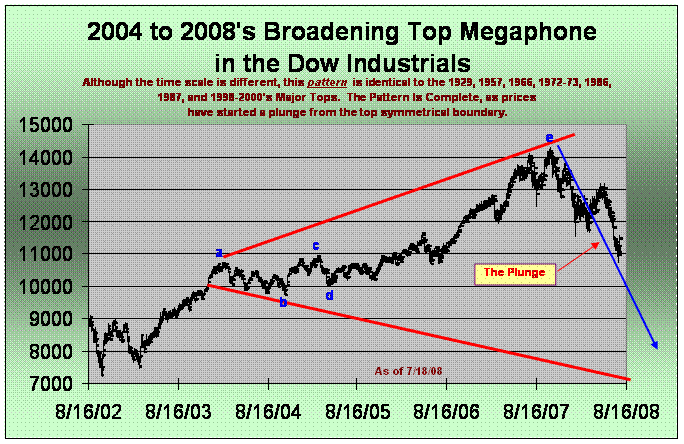
We presented these patterns back in February 2007, warning subscribers that 2004/07 had the same pattern, and we were at great risk of a similar plunge in 2007.
Above we update the same chart as of July 18th, 2008, showing that this pattern has once again proved prescient . We believe the plunge is not over, however a short reprieve for a few weeks has started. This plunge is officially a Bear Market, and is a stock market crash . The Industrials have declined 3,370 points, or 23.7 percent so far, from October 11th, 2007's intraday all-time high of 14,198 to this past Tuesday's 10,827, July 15th 2008. More decline is likely.
What is the point of all this? Technical analysis works, and had one paid attention to this time-tested pattern, a boatload of heartache and financial loss could have been avoided. We got heavy into cash, Treasuries and Gold in late 2007 in our Conservative Investment Portfolio after seeing this pattern. It has paid off nicely for our subscribers. A look at that portfolio is available at the Conservative Portfolio button at www.technicalindicatorindex.com for those of you who are interested.
The following pages show the patterns for the aforementioned plunges.
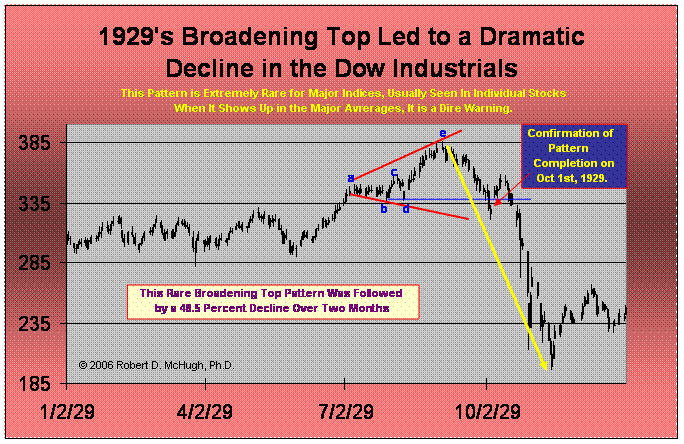
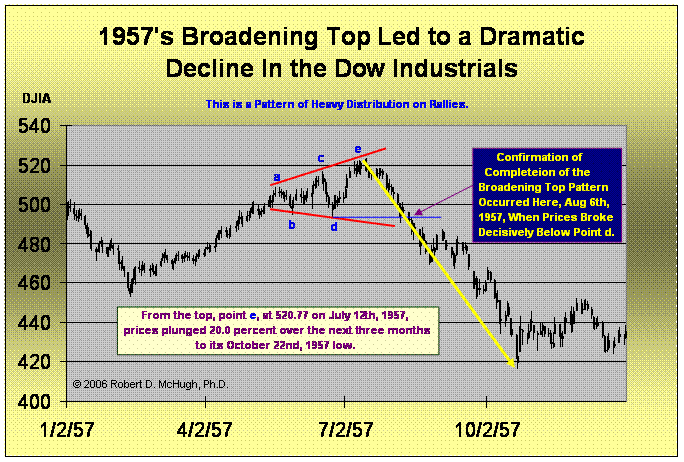
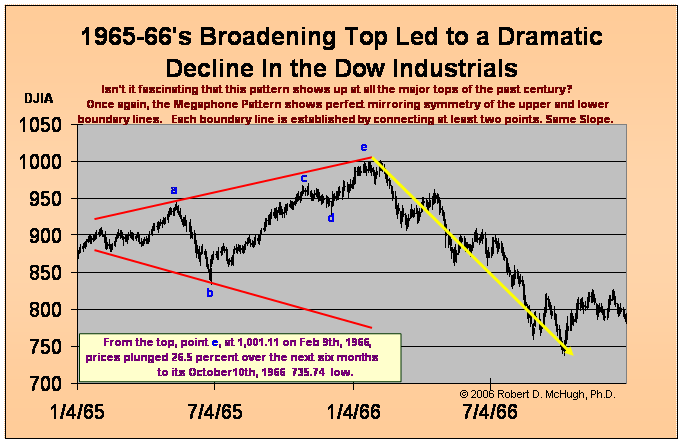
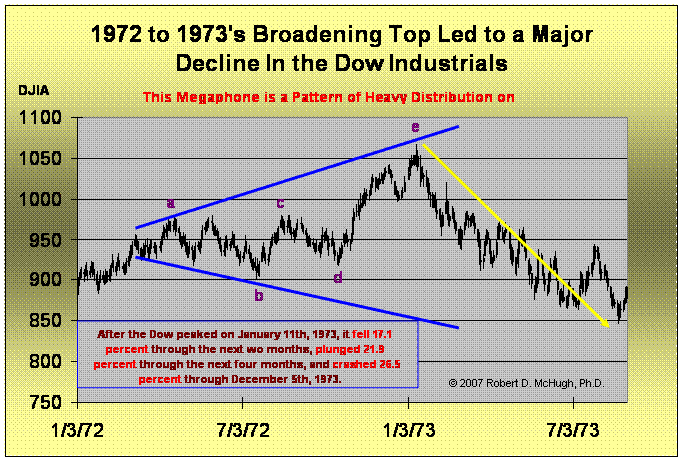
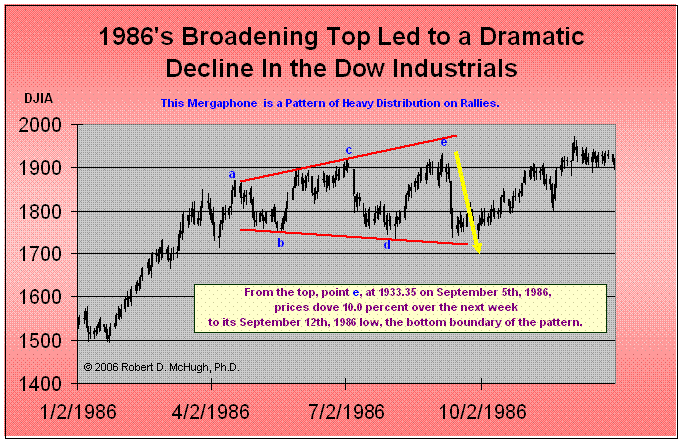
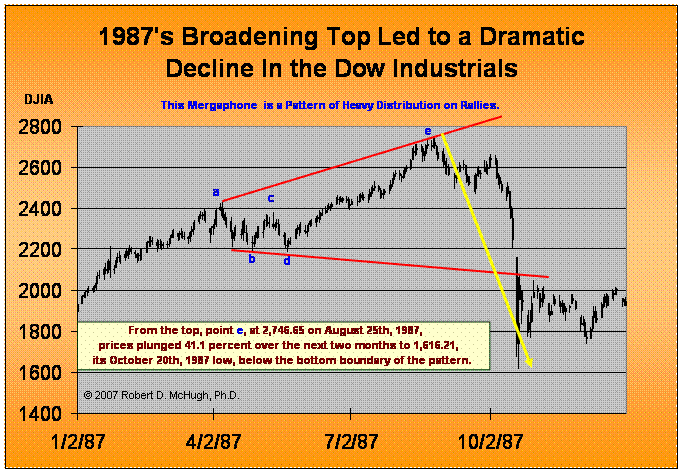
The current pattern from 2004 to 2008 most closely resembles the 1929 and 1972/73 patterns where point d is slightly above point b . It isn't too far from the 1987 pattern in resemblance either . In each of those past three patterns, points c and d were modest moves, and fairly close in time to points a and b . In all three of these past patterns, the distance from point d to point e is extremely long.
The Master Planner's efforts to avoid the horrendous decline these past three similar Broadening Top patterns produced failed, and unless they get on the stick, more damage is likely.
What can the Master Planners do? We have suggested in the past that merely making liquidity available to Wall Street banking firms and commercial banks is not going to get the job done . The Central Bankers believe that if they merely take care of Wall Street, everything will be okay, as the money trickles down. This time it will not. Why is this time different? Because Main Street is losing the value of their homes, is losing their jobs, is losing their capacity to borrow and spend, has no savings, is not in a position to weather the storm. No, the Master Planners will have to print and hand out money to every household in America to bail this crisis out. The dollar will be sacrificed — that is no longer at issue. Hyperinflation will have to happen to avoid a 1930s style depression. We expect that the Master Planners will recognize this. Our concern is whether or not they will realize the solution soon enough to avoid a whole lot of pain.
We may have to see a “print money, reverse tax” event , where the Fed (or the U.S. Treasury) prints money, then mails a fat check to every household on the tax rolls, substiantially more than the recent tax rebate, which accompished nothing. The dollar will depreciate, however debts — which are sinking this ship — are priced in yesterday's pre-hyperinflation dollars, so the reverse-tax handout can be used by Main Street to payoff debt and get back on their feet. Our guess is the Fed and its partners will take at least a year before they consider this — which is bad news for Main Street.
Go to www.technicalindicatorindex.com and click
On the Free Trial button at the upper right of the home page.
Or, you can grab a great offer, 5 months for $99
By clicking on the Subscribe Today button
At our home page.
“Jesus said to them, “I am the bread of life; he who comes to Me
shall not hunger, and he who believes in Me shall never thirst.
For I have come down from heaven,
For this is the will of My Father, that everyone who beholds
the Son and believes in Him, may have eternal life;
and I Myself will raise him up on the last day.”
John 6: 35, 38, 40
by Robert McHugh, Ph.D.
technicalindicatorindex.com
Robert McHugh Ph.D. is President and CEO of Main Line Investors, Inc., a registered investment advisor in the Commonwealth of Pennsylvania, and can be reached at www.technicalindicatorindex.com.
The statements, opinions, buy and sell signals, and analyses presented in this newsletter are provided as a general information and education service only. Opinions, estimates, buy and sell signals, and probabilities expressed herein constitute the judgment of the author as of the date indicated and are subject to change without notice. Nothing contained in this newsletter is intended to be, nor shall it be construed as, investment advice, nor is it to be relied upon in making any investment or other decision. Prior to making any investment decision, you are advised to consult with your broker, investment advisor or other appropriate tax or financial professional to determine the suitability of any investment. Neither Main Line Investors, Inc. nor Robert D. McHugh, Jr., Ph.D. Editor shall be responsible or have any liability for investment decisions based upon, or the results obtained from, the information provided. Copyright 2008, Main Line Investors, Inc. All Rights Reserved.
Robert McHugh, Ph.D Archive |
© 2005-2022 http://www.MarketOracle.co.uk - The Market Oracle is a FREE Daily Financial Markets Analysis & Forecasting online publication.


