Stock Market Crash..or No Crash?
Stock-Markets / Stock Markets 2016 Oct 17, 2016 - 02:31 PM GMT Martin Armstrong writes, “Apparently, there are a lot of people calling for a crash in the stock market as usual claiming it looks just like 1987. Sorry, there is nothing of that magnitude showing up at this time. We did elect one Weekly Bearish Reversal back at 18368. However, the main bank of support lies at 17710 followed by 17330. Only a weekly closing below 17330 would hint of a more serious correction.”
I agree that this market does not look like 1987. Trying to make a parallel between this market and another period is usually futile.
However, he points out to PAY ATTENTION to a break of the September 14 low at 17992.21….as I do, as well. This would warn of a drop to a lower level of support.
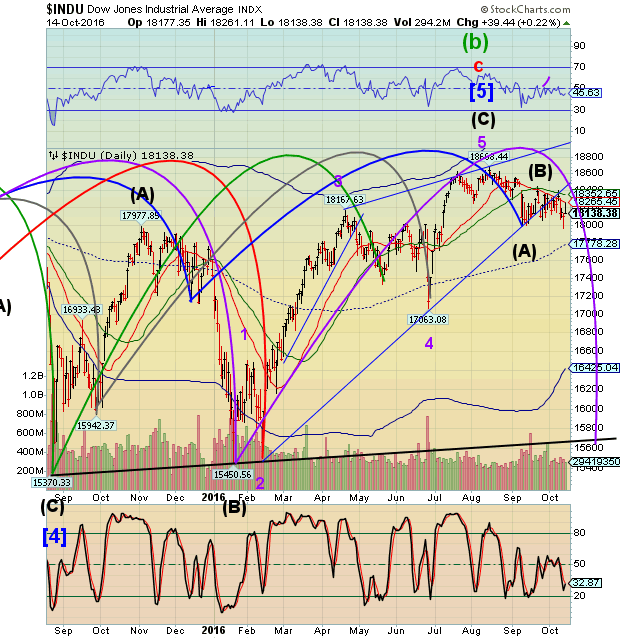
A lot of Armstrong’s computer analysis is based on pattern recognition. However, he may not have catalogued certain bear market patterns. For example, there is no recognition of the break of the lower trendline of the Ending Diagonal extending back to January 20.
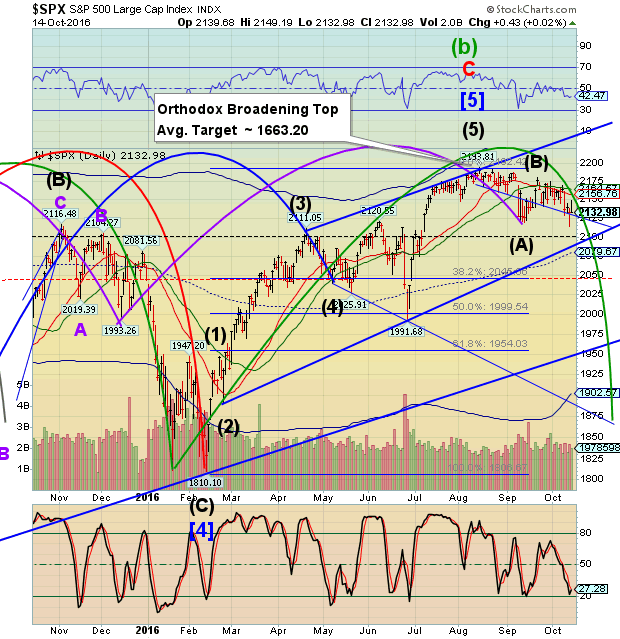
SPX has not broken its 9-month trendline, but it has broken the lower trendline of an Orthodox Broadening Top, which has a high probability (96%) of at least a 10% correction, if not the full monte.
ZeroHedge reports, “World stocks started the week in the red Monday as the dollar touched a 7-month high and U.S. and European government bond yields climbed to their highest since June following the Friday speeches by Eric Rosengren and Janet Yellen which hinted the Fed's next step could be to pursue a steepening of the TSY yield curve the same as the BOJ.
Echoing what we said previously, Ric Spooner, chief market analyst at CMC Markets in Sydney, wrote that "markets are reacting to the possibility that the Fed might join the Bank of Japan in conducting policy to steepen the yield curve. In the Fed's case, this might amount to running the gauntlet of higher inflation with a very slow pace of monetary tightening."
TNX appears to be drifting lower after challenging its 2-hour Cycle top at 17.97 on Friday and probing as high as 18.14 in the futures over the weekend.
The higher probe does not appear to register in today’s action, now that the cash market in Treasuries is open. If that resistance holds, we may have a reversal pattern the portends lower yields.
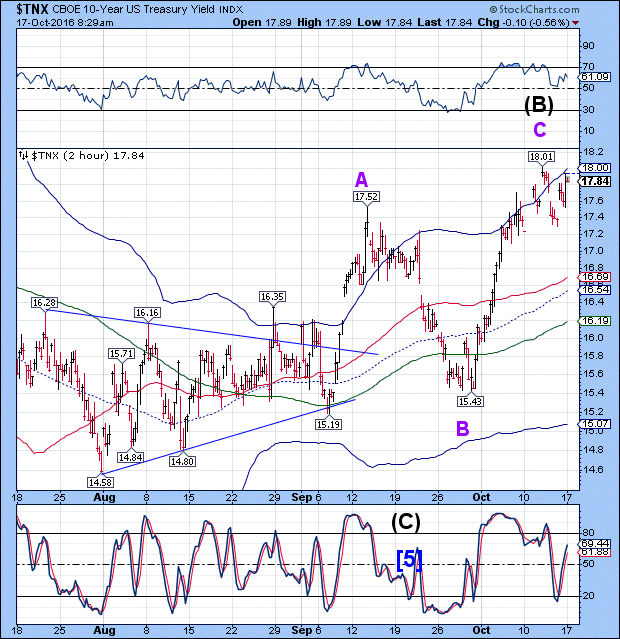
TNX is scheduled for a Master Cyle low starting in the last week of October. If the Cycles are on a two-week delay as I have suggested, that low may extend through election day.
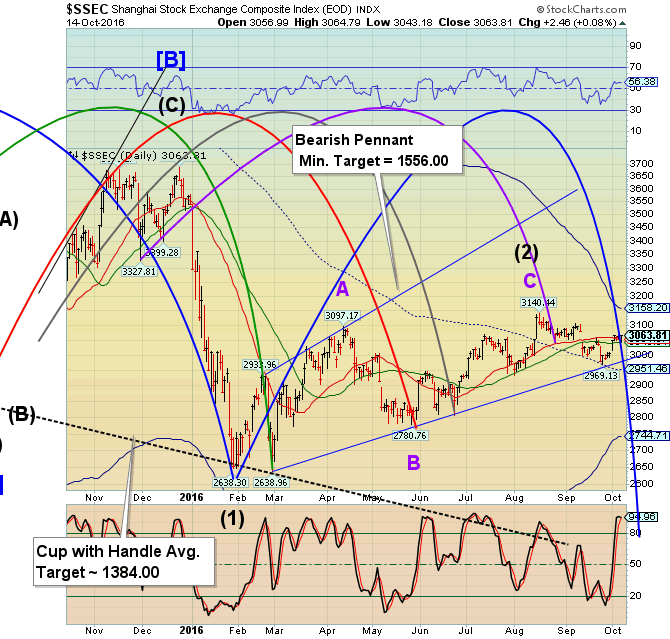
The Shanghai Index B-shares took a 6.2% hit this morning. The B-Shares are less liquid than the A-Shares that we see in the chart to the left. However, we may wish to watch this market. Thus far we only see a drop of 22.50 points in the Shanghai Composite. However, a drop beneath 3000.00 may set off a panic decline this week.
USD probed to 98.15 over the weekend, just three ticks high than the 98.12 high registered on Thursday. Whether it shows up in the daily cash market is unknown, but it appears that this weekend was marked by the Cycles Model for an (inverted) Trading Cycle high. It is now due for a sharp decline into a Master Cycle low that may not be complete until after the election.
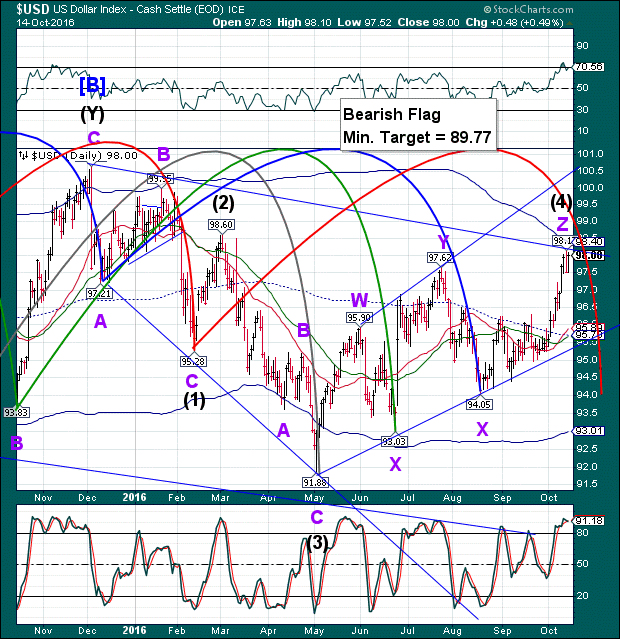
Gold also sports a Triangle Wave (B), as does the SPX. Whatever may be happening may affect stocks and commodities, including Gold, as the USD plummets. I hope that I am wrong and Gold offers a safe haven during the decline, but its looking less and less likely.
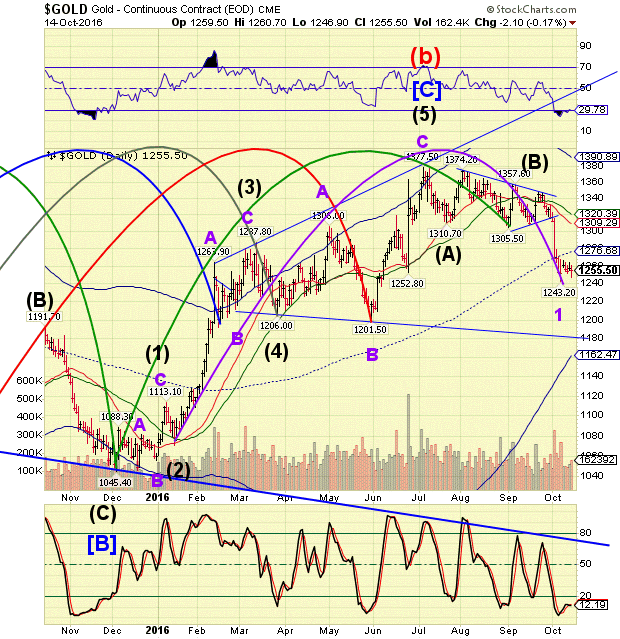
We should see a bounce, at least to the mid-Cycle resistance at 1255.50, but the Cycles Model says that the decline may continue for at least another 2 weeks. A drop beneath the Orthodox Broadening Top trendline at 1180.00 may trigger a decline to 900.00 or lower.
Regards,
Tony
Our Investment Advisor Registration is on the Web.
We are in the process of updating our website at www.thepracticalinvestor.com to have more information on our services. Log on and click on Advisor Registration to get more details.
If you are a client or wish to become one, please make an appointment to discuss our investment strategies by calling Connie or Tony at (517) 699-1554, ext 10 or 11. Or e-mail us at tpi@thepracticalinvestor.com .
Anthony M. Cherniawski, President and CIO http://www.thepracticalinvestor.com
As a State Registered Investment Advisor, The Practical Investor (TPI) manages private client investment portfolios using a proprietary investment strategy created by Chief Investment Officer Tony Cherniawski. Throughout 2000-01, when many investors felt the pain of double digit market losses, TPI successfully navigated the choppy investment waters, creating a profit for our private investment clients. With a focus on preserving assets and capitalizing on opportunities, TPI clients benefited greatly from the TPI strategies, allowing them to stay on track with their life goals.
Disclaimer: The content in this article is written for educational and informational purposes only. There is no offer or recommendation to buy or sell any security and no information contained here should be interpreted or construed as investment advice. Do you own due diligence as the information in this article is the opinion of Anthony M. Cherniawski and subject to change without notice.
Anthony M. Cherniawski Archive |
© 2005-2022 http://www.MarketOracle.co.uk - The Market Oracle is a FREE Daily Financial Markets Analysis & Forecasting online publication.


