


The 70-year US Treasury Bond Market Cycle and SPX Stocks Bull Market
Stock-Markets / US Bonds Dec 17, 2016 - 04:09 PM GMTBy: Tony_Caldaro

 The market started the week at SPX 2260. After a slightly lower open on Monday the SPX rallied to the current uptrend high at 2278 on Tuesday. On Wednesday the FED raised rates for the first time in a year and the market pulled back to SPX 2248. Then a rally on Thursday to SPX 2272 was followed by a smaller pullback into a Friday 2258 close. For the week the SPX/DOW were mixed, and the NDX/NAZ were mixed. Economics reports were plentiful and ended the week slightly positive. On the downtick: export/import prices, industrial production, capacity utilization, housing starts, build permits, plus the treasury budget increased. On the uptick: retail sales, the CPI/PPI, NY/Philly FED, the NAHB, the WLEI, plus weekly jobless claims declined. Next week’s reports will be highlighted by Q3 GDP, leading indicators and the PCE index. Best to your pre-holiday week!
BONDS
It certainly appears that the 70-year Bond market yield cycle has completed, as the 30YR Bond came within 7 basis points of its 2.03% all time low in 1946. If you read last week’s weekend update you will have immediately noticed that the Bond cycle is quite similar to the Saeculum cycle. The Bond cycle also displays quite remarkable symmetry. A low in 1946, a 35-year rise to a 1981 peak, then a 35-year decline to the recent 2016 low at 2.10%. The chart also displays the entire decline from 9.46% in 1988 to the recent 2.10% low was within 7 basis of the initial a-b-c down to 7.16% in 1986. Quite symmetrical indeed.
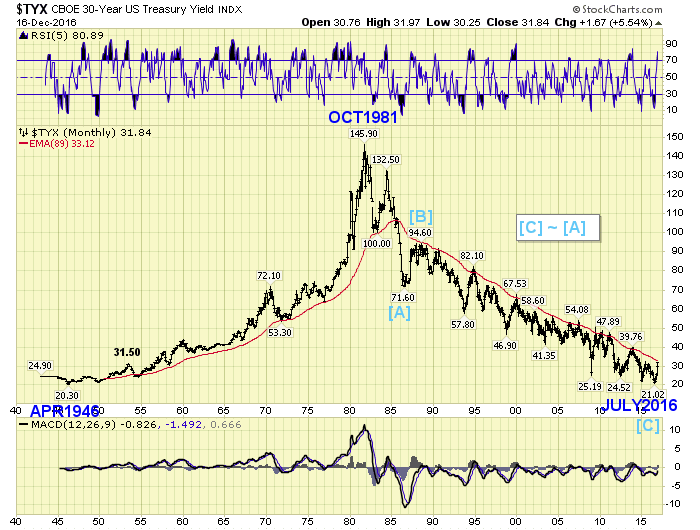
Our initial thoughts, coming off the July low, was that it would take quite a number of years for the 30YR to even reach 5% in this new 35-year rising rate environment. Coming off the 1946 low it took 7 years just for yields to reach 3%. That is obviously not the situation now. Bond markets are much, much bigger. Also futures trading began in the 1970’s, and one can clearly see their volatile impact on the Bond market since that time. During this rising cycle it took only 4 months for rates to rise from the July 2.1 % low to over 3%. This suggests the new 35-year rise will be just as volatile as the 35-year decline. You might also note the impact of the 89 EMA on the monthly chart.
In recent decades Bond market pundits have concentrated more on the 10YR than the 30YR Bond. We have data on the 10YR going back to 1962. One can observe how it tracks the same exact 70-year cycle. In fact, the chart displays the entire decline from 10.23% in 1987 to the recent 1.34% low was “exactly” the length of the initial a-b-c down from 15.84% to 6.95% in 1986. That is unlikely to be coincidence. You might also note the impact of the 89 EMA and 144 EMA on this monthly chart. What’s next?
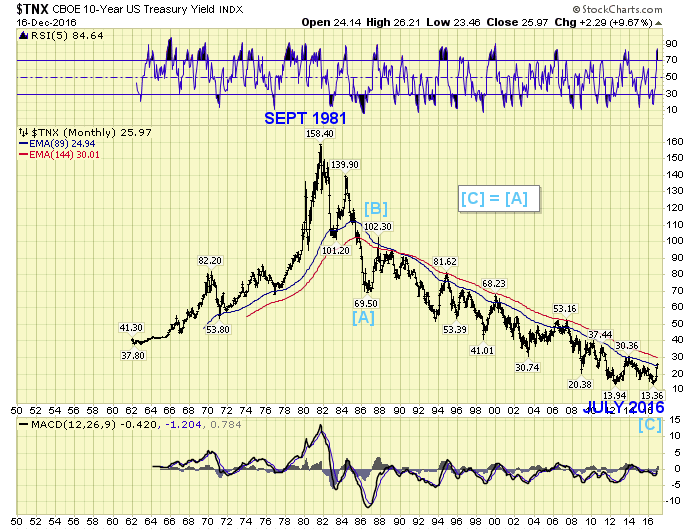
The 35-year decline in 10YR rates left many, many resistance levels during its decline. Since the two declines, (1981-1986 and 1987-2016), were perfectly matched, these resistance levels are very likely to be respected during the next 35-year rate advance. Also, the monthly 89 and 144 EMAs will come into play. The first resistance level, which also happens to be where the 89 EMA is at this time, was 2.49%. 10YR yields hit that level precisely on December 1st. Then after a small pullback rates have moved higher: 2.62% late this week. The next resistance level is at 3.04%, which is about where the 144 EMA is at this time. This is likely the next upside target. With these tidbits of information, and the chart, Bond traders/investors can take it from there. Keep in mind, Bonds will be in a bear market, and rates will be generally rising, for the next 35 years.
LONG TERM: uptrend
The Primary III bull market, from the February SPX 1810 low, continues to unfold as expected. This week the SPX again made all-time new highs, and the DOW approached 20,000 for the first time in history. Our count suggests the market is currently in Major wave 1, of a five Major wave Primary III. Major 1 has divided into five Intermediate waves, and Intermediate wave iii is dividing into five Minor waves. This is quite normal for a bull market structure.
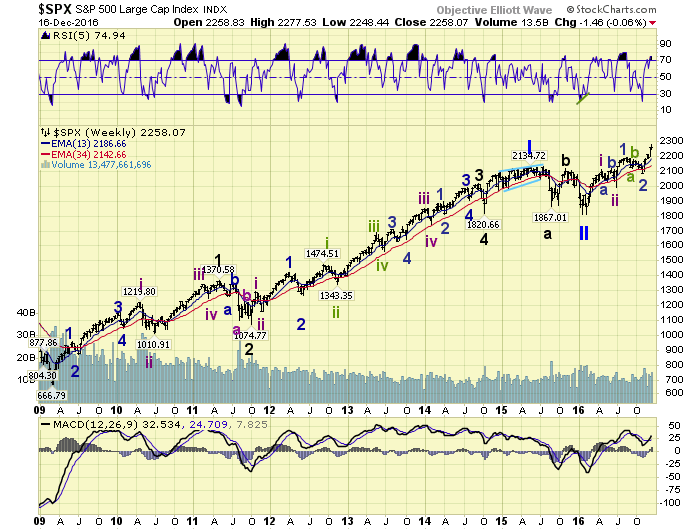
Intermediate waves i and ii completed at SPX 21111 in April and SPX 1992 in June. Minor waves 1 and 2 completed at SPX 2193 in August and SPX 2084 in November. Minor wave 3 is currently underway and has already reached SPX 2278. If our estimates are correct Minor 3 should reach the SPX 2380’s some time in January.
MEDIUM TERM: uptrend
This Minor 3 uptrend began just a few days before the presidential election on November 8th. While many were touting a stock market collapse if Trump was elected, the market has done, naturally, just the opposite. From the Minor 2 downtrend low at SPX 2084 the market rallied in Minute wave i to SPX 2214 by late November. It then pulled back in a Minute wave ii to SPX 2187 just a few days later. Since then it has been rising in a Minute wave iii.
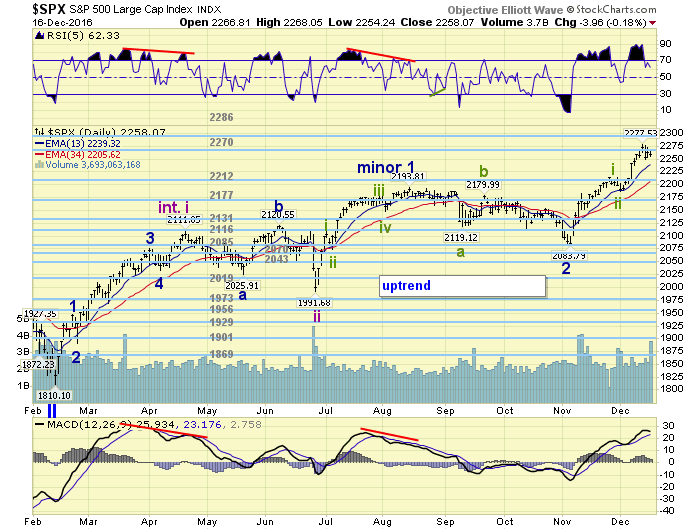
This week the uptrend hit SPX 2278, and then pulled back about 30 points. While the pullback is sufficient for Minute iii to complete with a Minute iv underway, we are not yet suggesting that scenario for a number of reasons. First, the recent rally from the Minute ii low is shorter than the Minute i rally. Not typical for third waves. Also the market has yet to quantify a Minute iv. This would currently require a drop into the SPX 2230’s. Until that occurs we are expecting Minute wave iii to continue higher. Medium term support is at the 2212 and 2177 pivots, with resistance at the 2270 and 2286 pivots.
SHORT TERM
Minute wave i (SPX 2084-2214) unfolded in 27 small waves. Minute wave iii thus far (SPX 2187-2278) has unfolded in just 9 small waves. In fact, the entire Minute iii rally thus far looks more like the first wave up of Minute i: (SPX 2084-2182). They were both a bit short of 100 points, and were followed by a quick then choppy pullback of 30+ points. Something to keep in mind heading into an expected quiet holiday week.
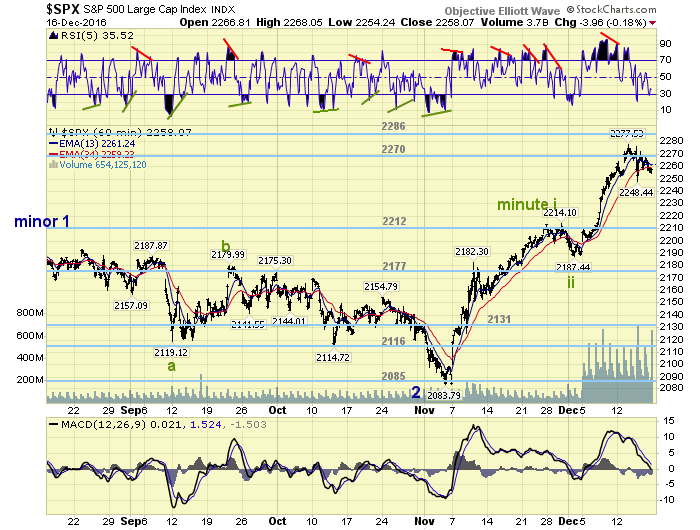
Last weekend we suggested the tight ranged 2270 and 2286 pivots should offer some resistance. The rally stopped right in between at SPX 2278 before the 30 point pullback. Once these two pivots are cleared the market will have some room to run. The next pivot is at SPX 2321. Short term support is at SPX 2248 and the SPX 2230’s, with resistance at the 2270 and 2286 pivots. Short term momentum ended the week just above oversold.
FOREIGN MARKETS
Asian markets were mostly lower losing 1.2% on the week.
European markets were all higher gaining 2.1% on the week.
The DJ World index lost 0.5% on the week.
COMMODITIES
Bonds continue to downtrend and lost 0.9% on the week.
Crude remains in an uptrend and gained 2.8% on the week.
Gold continues to downtrend and lost 2.1% on the week.
The USD is still in an uptrend and gained 1.3% on the week.
NEXT WEEK
Monday: a speech from FED chair Yellen at 1:30. Wednesday: existing home sales. Thursday: Q3 GDP (est. +3.2%), weekly jobless claims, durables goods orders, leading indicators, personal income/spending, and the PCE. Friday: consumer sentiment and new home sales.
CHARTS: http://stockcharts.com/public/1269446/tenpp
After about 40 years of investing in the markets one learns that the markets are constantly changing, not only in price, but in what drives the markets. In the 1960s, the Nifty Fifty were the leaders of the stock market. In the 1970s, stock selection using Technical Analysis was important, as the market stayed with a trading range for the entire decade. In the 1980s, the market finally broke out of it doldrums, as the DOW broke through 1100 in 1982, and launched the greatest bull market on record.
Sharing is an important aspect of a life. Over 100 people have joined our group, from all walks of life, covering twenty three countries across the globe. It's been the most fun I have ever had in the market. Sharing uncommon knowledge, with investors. In hope of aiding them in finding their financial independence.
Copyright © 2016 Tony Caldaro - All Rights Reserved Disclaimer: The above is a matter of opinion provided for general information purposes only and is not intended as investment advice. Information and analysis above are derived from sources and utilising methods believed to be reliable, but we cannot accept responsibility for any losses you may incur as a result of this analysis. Individuals should consult with their personal financial advisors.
Tony Caldaro Archive |
© 2005-2022 http://www.MarketOracle.co.uk - The Market Oracle is a FREE Daily Financial Markets Analysis & Forecasting online publication.