


S&P 500 Gets Close To Record High As Investors' Sentiment Improves
Stock-Markets / Stock Markets 2016 Jan 05, 2017 - 12:36 PM GMTBy: Paul_Rejczak

 Briefly: In our opinion, speculative short positions are favored (with stop-loss at 2,330, and profit target at 2,150, S&P 500 index).
Our intraday outlook remains bearish, and our short-term outlook is bearish. Our medium-term outlook remains neutral, following S&P 500 index breakout above last year's all-time high:
Intraday outlook (next 24 hours): bearish
Short-term outlook (next 1-2 weeks): bearish
Medium-term outlook (next 1-3 months): neutral
Long-term outlook (next year): neutral
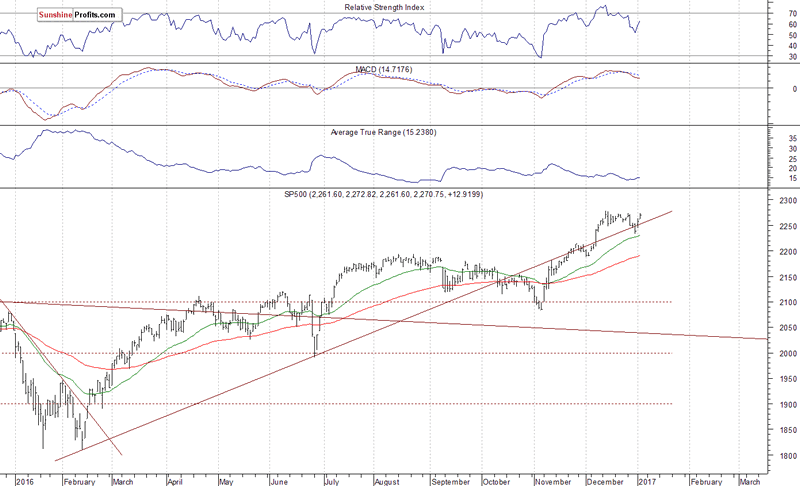
The main U.S. stock market indexes gained between 0.3% and 0.6% on Wednesday, extending their short-term uptrend, as investors' sentiment remained bullish following Tuesday's rally. The S&P 500 index continues to trade relatively close to its December 13 all-time high of 2,277.53. For now, it looks like a flat correction within an uptrend off last year's early November low. But will the market extend its year-long uptrend even further before some more meaningful downward correction? The nearest important level of resistance remains at around 2,280, marked by record high, and the next resistance level is at 2,300 mark. On the other hand, support level is at 2,250, marked by recent resistance level. The next support level remains at 2,200-2,220. The index continues to trade along its medium-term upward trend line. It also trades within a few-week-long consolidation, as the daily chart shows:
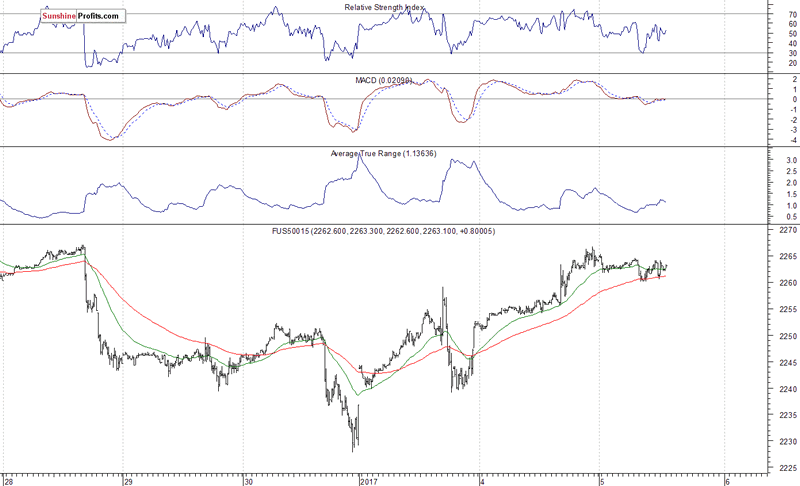
Expectations before the opening of today's trading session are virtually flat, following yesterday's move up. The index futures are currently down 0.1%. The European stock market indexes have been mixed so far. Investors will now wait for some economic data announcements: ADP Employment Change at 8:15 a.m., Initial Claims at 8:30 a.m., ISM Services number at 10:00 a.m. The ADP Employment Change report is a measure of the change in non-farm, private employment. It is a relatively important announcement ahead of tomorrow's monthly jobs data release from the U.S. Bureau of Labor Statistics. The S&P 500 futures contract trades within an intraday consolidation, as investors take some short-term profits off the table following this week's advance. It continues to trade above Friday's local highs along the level of 2,250. The next important level of resistance is at around 2,270-2,280, marked by previous consolidation along record highs. On the other hand, support level is at 2,250-2,255, marked by yesterday's consolidation, among others. The next support level is at around 2,240, marked by recent local low. For now, it looks like a flat correction within a short-term uptrend. However, the market remains below the resistance level marked by December consolidation. Will it break above its record highs?
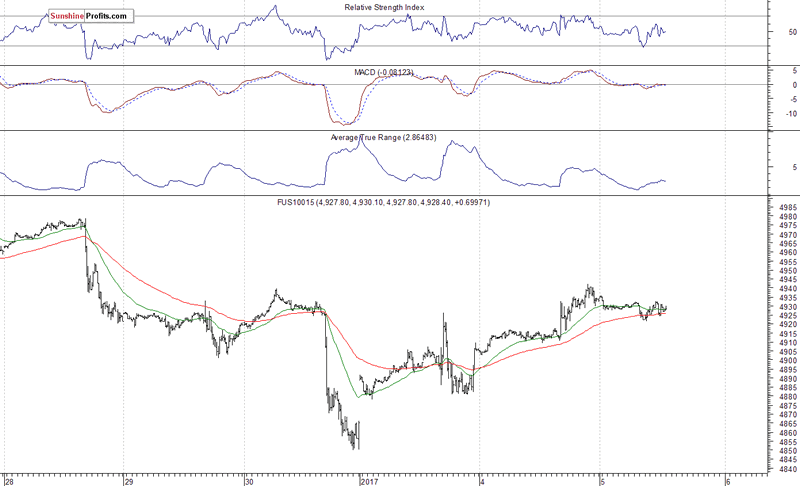
The technology Nasdaq 100 futures contract follows a similar path, as it currently trades within an intraday consolidation. The market has retraced its Friday's sell-off following a bounce off support level at around 4,850. The nearest important level of resistance is at around 4,920-4,940, marked by local highs, and the next resistance level is at 5,000 mark. For now, it looks like an upward correction within a short-term downtrend. Will the technology Nasdaq 100 futures contract resume its medium-term uptrend and break above round resistance level of 5,000? The technology stocks continue to fluctuate following November - December rally, as we can see on the 15-minute chart:
Concluding, the broad stock market retraced its late December decline over the past two days, as investors' sentiment improved sharply following global stock markets rally. Is this a new short-term uptrend or just upward correction? The S&P 500 index got back to its December trading range, marked by record high of 2,277.53. We still can see some medium-term overbought conditions accompanied by negative technical divergences. Therefore, we continue to maintain our speculative short position (opened on December 14 at 2,268.35 - opening price of the S&P 500 index). Stop-loss level remains at 2,330 and potential profit target is at 2,150 (S&P 500 index). You can trade S&P 500 index using futures contracts (S&P 500 futures contract - SP, E-mini S&P 500 futures contract - ES) or an ETF like the SPDR S&P 500 ETF - SPY. It is always important to set some exit price level in case some events cause the price to move in the unlikely direction. Having safety measures in place helps limit potential losses while letting the gains grow.
To summarize: short position in S&P 500 index is justified from the risk/reward perspective with the following entry prices, stop-loss orders and profit target price levels:
S&P 500 index - short position: profit target level: 2,150; stop-loss level: 2,330
S&P 500 futures contract (March 2017) - short position: profit target level: 2,145; stop-loss level: 2,325
SPY ETF (SPDR S&P 500, not leveraged) - short position: profit target level: $214; stop-loss level: $232
SDS ETF (ProShares UltraShort S&P500, leveraged: -2x) - long position: profit target level: $16.35; stop-loss level: $14.00 (calculated using trade's opening price on Dec 14 at $14.78).
Thank you.
Paul Rejczak
Stock Trading Strategist
Stock Trading Alerts
SunshineProfits.com
Stock market strategist, who has been known for quality of his technical and fundamental analysis since the late nineties. He is interested in forecasting market behavior based on both traditional and innovative methods of technical analysis. Paul has made his name by developing mechanical trading systems. Paul is the author of Sunshine Profits’ premium service for stock traders: Stock Trading Alerts.
* * * * *
Disclaimer
All essays, research and information found above represent analyses and opinions of Paul Rejczak and Sunshine Profits' associates only. As such, it may prove wrong and be a subject to change without notice. Opinions and analyses were based on data available to authors of respective essays at the time of writing. Although the information provided above is based on careful research and sources that are believed to be accurate, Paul Rejczak and his associates do not guarantee the accuracy or thoroughness of the data or information reported. The opinions published above are neither an offer nor a recommendation to purchase or sell any securities. Mr. Rejczak is not a Registered Securities Advisor. By reading Paul Rejczak’s reports you fully agree that he will not be held responsible or liable for any decisions you make regarding any information provided in these reports. Investing, trading and speculation in any financial markets may involve high risk of loss. Paul Rejczak, Sunshine Profits' employees and affiliates as well as members of their families may have a short or long position in any securities, including those mentioned in any of the reports or essays, and may make additional purchases and/or sales of those securities without notice.
Paul Rejczak Archive |
© 2005-2022 http://www.MarketOracle.co.uk - The Market Oracle is a FREE Daily Financial Markets Analysis & Forecasting online publication.