


There Is No Such Thing As Peak Oil Demand
Commodities / Crude Oil Mar 31, 2017 - 12:04 PM GMTBy: OilPrice_Com

 Notwithstanding that oil demand has increased for over 150 years, it will eventually stop increasing. If oil demand were to reach an actual peak, then the top might be easier to predict. As it stands, the forecast models of demand are likely predicting peak demand far later than it will be.
The so-called balance of supply and demand has always been a moving target, a race to the top in which the two run neck and neck. Imbalances result from out-of-step growth rates and not from movements away from a stationary balance. Perversely, imbalances breed further imbalances as the supply and demand components are provoked in opposite directions but with different timing, magnitudes and inertias. Without sufficient damping, the market has often overcompensated. Of course, there are also exogenous events like political turmoil, policy shifts, technological innovations and demographic changes which can unexpectedly and significantly alter not just the immediate balance but fundamentally shift the way supply and demand curves respond to price movements. The trends are plagued by inherent and irreducible irregularities.
Such a structural change has recently occurred. High prices persisted long enough for the industry in the U.S. to build a larger fleet of modern rigs and to learn how effectively to hydraulically fracture shale wells. It also persisted long enough for new efficiencies to incubate towards maturity, and the Paris accords promised to further reduce carbon emissions through policy changes. By the time that Saudi Arabia finally acted to protect not only its place among suppliers but also, and more importantly, the role of oil in the world economy. The backbone of shale supply in the U.S. was strong, and the seeds of lesser use were established. After these fundamental shifts, the rest of the world realized what Saudi Oil Minister Al-Naimi argued long ago and what Shell Oil has more recently asserted, namely that peak demand will occur long before peak supply.
To understand the trajectory of demand growth, we turn to econometric models like those published by the EIA and IEA. The central problem with long term supply and demand models is that they require assumptions about the many and interrelated responses to today's prices. Though modeled responses may be tuned with low precision to relatively recent events and new realities, the actual response curves are poorly constrained and continue to evolve, in some cases at an accelerating pace. As the aphorism goes, all models are wrong, but some are useful.
The EIA, IEA and other public econometric models call for global oil demand to continue growing through 2040, and the EIA even calls for renewed growth in the U.S. and OECD demand. The forecasts of growth in global demand rely upon increased use by developing countries, most importantly China and India. On the other hand, the United States has already seen demand decline for about 13 years. In fact it was the second to last of the world's seven major developed countries to enter demand decline, and the entire OECD group of countries has, as a whole, seen shrinking demand since 2007. EIA data shows that 35 countries in all have already reached and descended from maximum oil demand. The experience of projected versus actual peak oil demand in the U.S. and OECD countries provides an empirical test and thus context to evaluate the current forecasts of growth and delayed maximum.
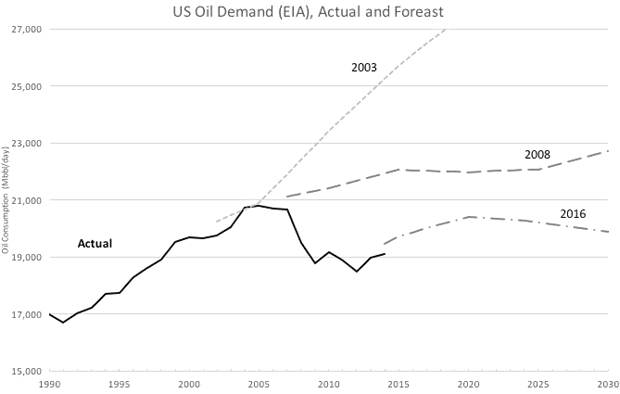
The following chart compares actual oil demand in the U.S. to several relevant demand forecasts of the EIA, all data coming from the EIA itself. U.S. demand reached a plateau for four years ending in 2007. Before, during, and even after the actual maximum demand, the models predicted decades of growth.
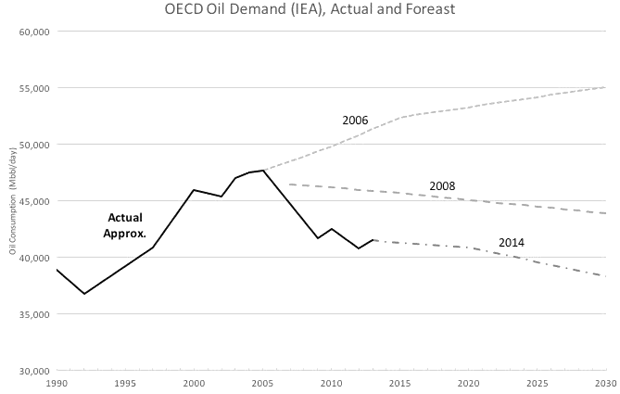
The next chart shows the same kind of comparison for the IEA's models of OECD oil demand. Actual demand gently achieved its maximum in 2005. Even the alternative policy (lower demand) case in 2006 failed to capture the impending decline, but the reference cases adapted to the reality of declining demand much more quickly than did the EIA. Still the IEA over predicted the actual demand. Though not shown in charts, the EIA's model of OECD demand growth and the IEA's model of U.S. demand growth follow the same patterns. In short, these deeply technical and widely used referenced models missed badly the pivot point, the watershed of the object of analysis. For truly exculpatory reasons, the second and third order dynamics of reality were not captured by the models.
Rather than the theoretical calculation by such models, empirical observation of history is likely more informative when it comes to anticipating the timing of maximum demand. The graph below normalizes annual oil demand from the G7 countries with the U.S. shown in black, each normalized to its own year and volume of maximum demand. The scales show a 15 year window around the maximum annual consumption, and the pattern of the G7 is repeated in the OECD total and in most all of the 28 other countries.
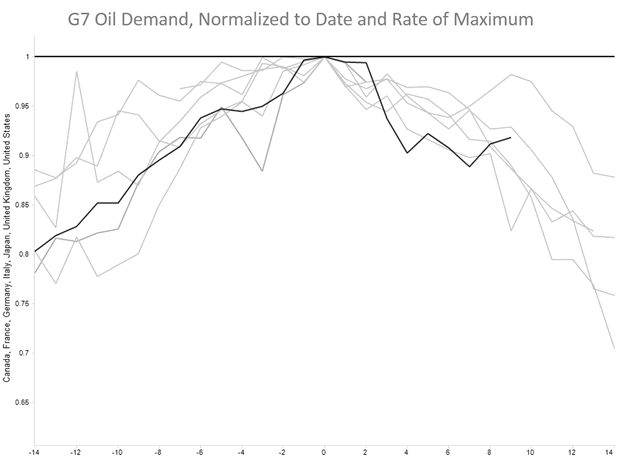
The same data viewed on the scale of generations may resemble an alpine peak, but from the experience of living through it, demand does not peak. It sputters, surges and stalls as it rolls over from a slow incline into a slow decline. It is less a peak and more a crest of demand.
Sequential global demand forecasts over the last decade have projected slower growth, mostly now forecast at less than 1 percent, and sensitivity cases now allow for the possibility of substantial demand decline by 2040. Unfortunately, experience demonstrates that the crest will likely occur unexpectedly and sooner than predicted. And then our industry enters a whole new world as the moving balance of supply and demand turns into a race to the bottom.
Link to original article: http://oilprice.com/Energy/Oil-Prices/There-Is-No-Such-Thing-As-Peak-Oil-Demand.html
By Dwayne Purvis for Oilprice.com
© 2017 Copyright OilPrice.com - All Rights Reserved
Disclaimer: The above is a matter of opinion provided for general information purposes only and is not intended as investment advice. Information and analysis above are derived from sources and utilising methods believed to be reliable, but we cannot accept responsibility for any losses you may incur as a result of this analysis. Individuals should consult with their personal financial advisors.
OilPrice.com Archive |
© 2005-2022 http://www.MarketOracle.co.uk - The Market Oracle is a FREE Daily Financial Markets Analysis & Forecasting online publication.