Strong US Dollar Investment Implications for Stocks and Gold
Currencies / US Dollar Aug 18, 2008 - 06:38 AM GMTBy: Chris_Ciovacco
 Mohamed El-Erian is the former highly successful manager of the Harvard endowment and current head of PIMCO. In an August 15, 2008 Bloomberg interview, he makes some comments which may help us to begin to understand the recent surge in the dollar in the face of less-than-ideal U.S. economic conditions.
"Currencies move not because they ought to but because they are allowed to. Previously rigid currencies are going to become more flexible because it is in their own interest."
While respecting there are numerous factors influencing the currency markets not covered here , my interpretation of his comments:
- The dollar is moving in part because some countries and central banks around the globe want to see it move for specific reasons.
- Once the move was set in motion, currency traders and money managers saw it and responded to it, which gave the move more momentum. Short covering played a role as well.
- The dollar's recent surge was influenced more by orchestrated actions than a change in long-term dollar fundamentals.
We would be remiss if we did not mention the obvious importance in the currency markets of slowing of growth in Europe and the possible impact on interest rate differentials between the dollar and euro.
What Happened In The Last Month?
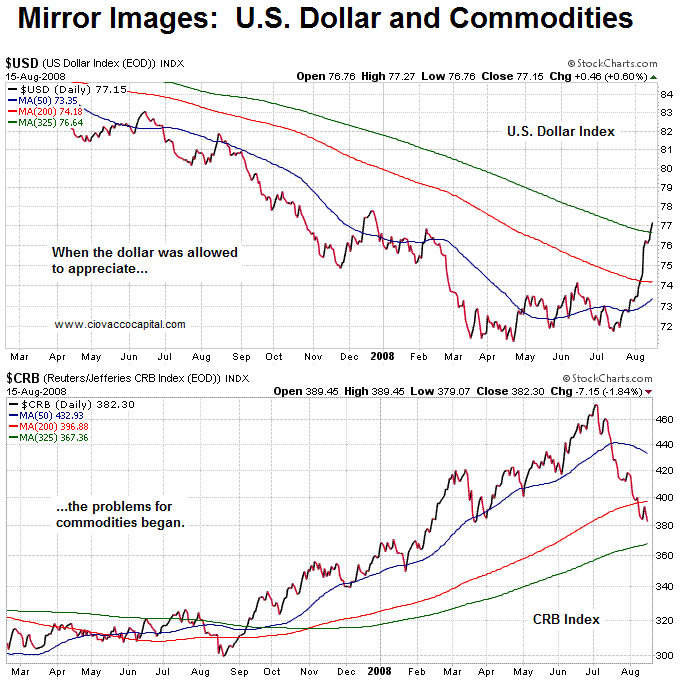
Commodities have rapidly reversed course and the dollar has made a countertrend move the likes of have not been seen for almost 40 years. Regardless of where markets head from here, the magnitude of the moves have pushed principal protection to the forefront. The charts below show both the dollar and commodities from March 2007 to the present. Note in the dollar chart, the 200-day moving average (MA), shown in red, and the 325-day MA (in green) have not been even seriously tested in the last 18 months until now.
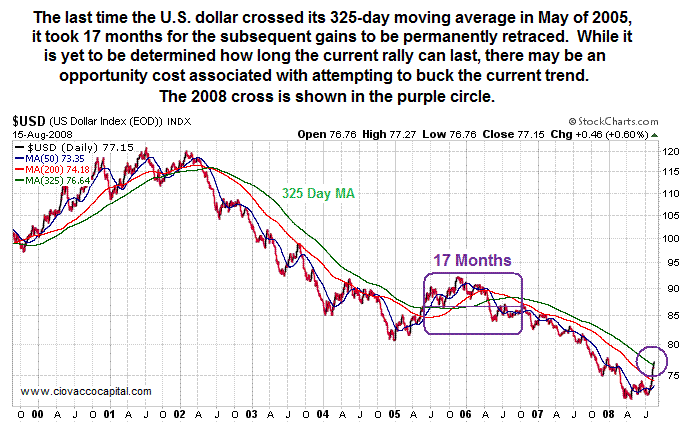
The chart below shows it may be a mistake to assume the move in the dollar will not last very long. Like all the charts we present, the purpose is not to predict or forecast, but to understand possible realistic scenarios which could play out.
Secular and Cyclical Trends
The long-term story for a weak dollar remains intact. The long-term story for strength in commodities remains intact. These stories (or fundamentals) apply to a period that could last almost twenty years and are referred to as secular stories or trends. Based on history, it is important to understand that counter-trends or cyclical retracements of secular trends can be of significant magnitude and duration. More importantly, they can destroy principal even when you have correctly identified the long-term fundamentals. The chart below of gold prices from 1973 through 1981 illustrates the point. Even if you have the story right, are you willing and emotionally able to suffer a 48% loss in a core position?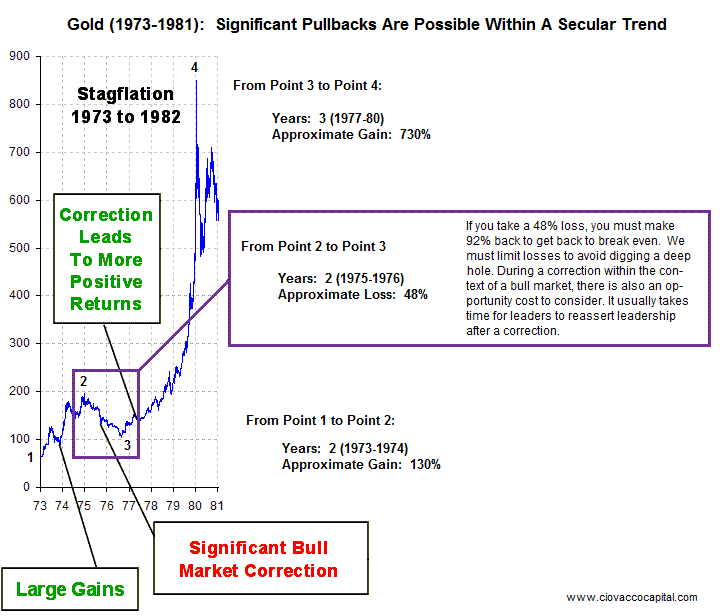
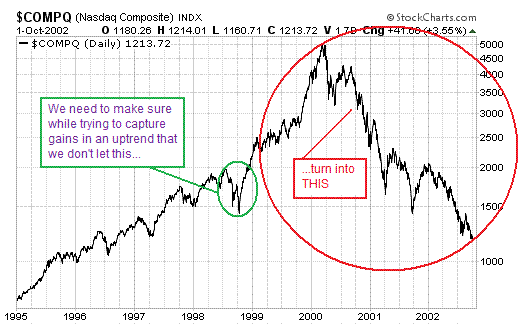
The chart of the NASDAQ (below) illustrates our task, which is to balance the desire to stay with a secular trend with the need to protect against large and hard to recover from losses.
What Could Be The Motivation To Want A Stronger Dollar?
While complex financial markets never have singular and simple cause and effect relationships, we can identify a few of the major contributors to the significant shifts which have occurred in the last month. When examining the related movements between the dollar and commodities, the classic chicken and egg question always comes into play. Of the many possible reasons to set an orchestrated dollar move in motion are:
- A weak dollar has contributed to global inflation which cannot easily be addressed by central banks raising interest rates in the face of slowing economies and a credit crisis.
- European exports have been seriously negatively impacted by the weak dollar/strong euro.
- Additional evidence of European economic weakness has surfaced in recent weeks.
- The same issues, exports and economic weakness, also apply to the emerging market economies.
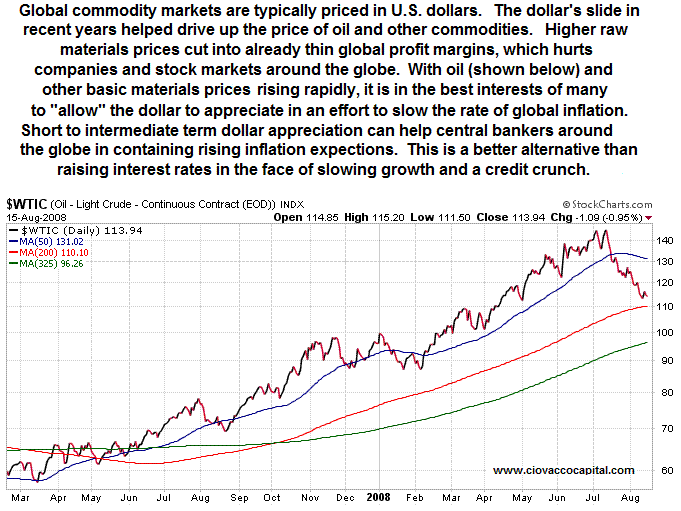
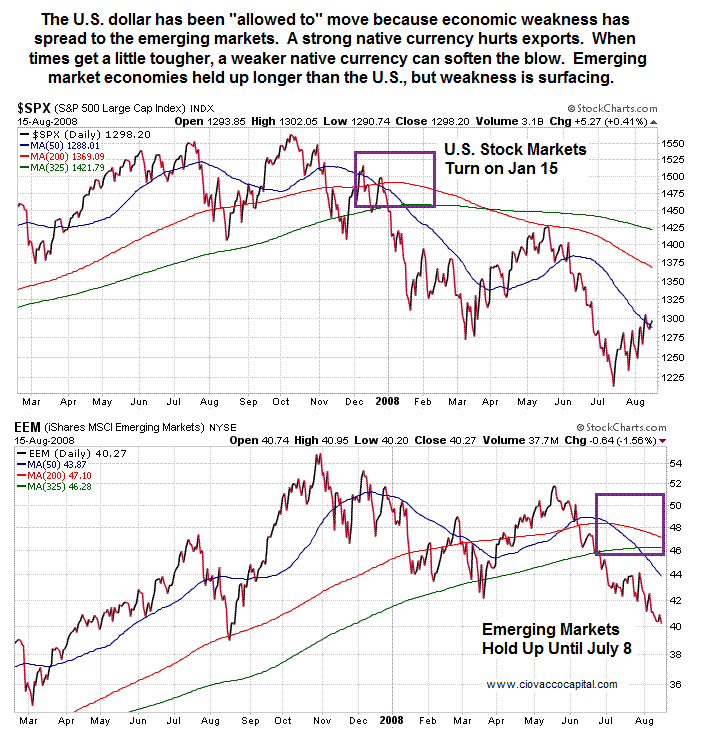
The major drawback for the U.S. is the weak dollar has helped fuel a significant increase in exports. The surge in exports has propped up America's GDP in recent quarters. From the Saturday, August 16, 2008 edition of The Wall Street Journal:
"A stronger dollar, if sustained over a longer term, could put the U.S. economy on shakier ground by raising the cost of exports. Without the improving U.S. trade position, the U.S. economy would have contracted in the second quarter. Exports grew at a robust 9% annual rate during the quarter, helped along by the cumulative effects of the dollar's weakening in recent years."
When Fundamentals and Technicals Fail to Align
My read-between-the-lines of the current economic environment includes:
- The Fed's attempt to prop up the economy by lowering interest rates has not and is not working, which is no secret to anyone.
- The availability of credit is contracting which is exactly what the Fed was trying to avoid by lowering rates.
- Stock markets around the globe are not anticipating a significant recovery anytime soon.
- Banks still have serious problems with continued deterioration of their balance sheets caused primarily by falling home prices, which have no rationale hope for finding a permanent bottom anytime soon.
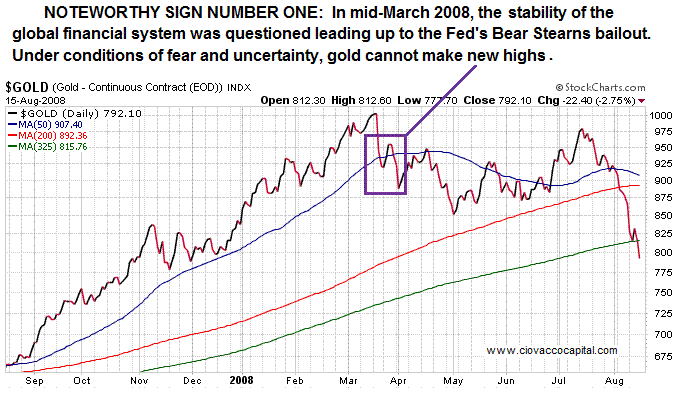
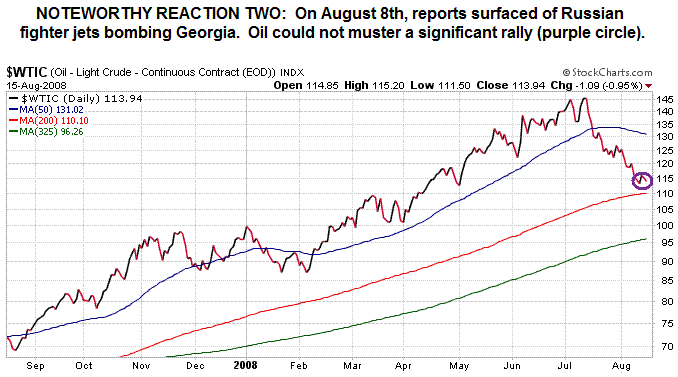
- The recent slide in commodity prices underscores the contraction of credit, housing outlook, and anticipated future economic weakness. This is not good for stocks.
- At least for the time being, financial markets are placing economic weakness and the possibility of deflation ahead of any concerns about possible future inflation.
- All asset prices, including commodities, are on the ropes.
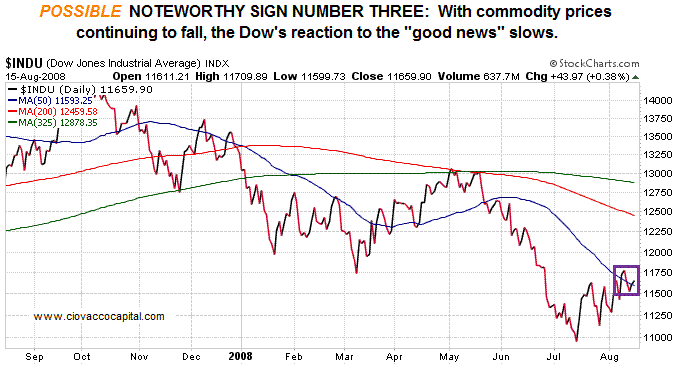
- Based on the evidence we have today, a rapid reversal in the U.S. stock market is possible between current levels and 1,365 on the S&P 500 (now at 1,298).
- A possible, but much less probable, outcome is for stocks to respond positively, in a rapid upside move, to falling commodity prices and break through 1,365. The basis for this scenario is that capital is flowing out of commodities and could rush into stocks if managers feel they are being left behind. The move could take the form of an upside "blow off" where the panic buying is quickly replaced with panic selling.
The concepts above appear to be supported by recent disconnects between some fundamental and technical elements in both commodities and stock markets.
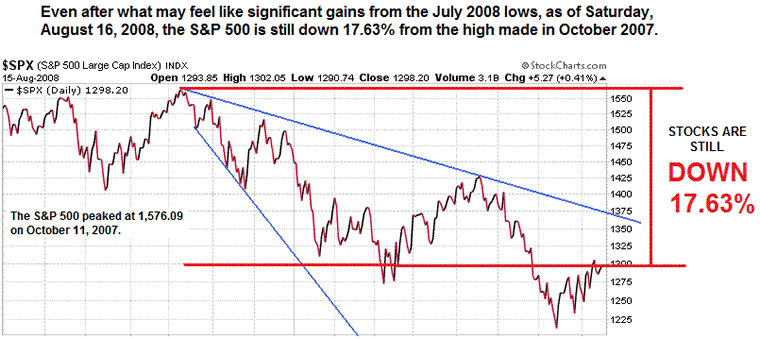
Stocks Remain in Downtrend
The S&P 500 Index remains 17.63% below its 2007 high. As the blue lines in the chart below illustrate, despite a month of gains, the primary trend in stocks is still firmly down. A downtrend means if you are betting or hoping that stocks have bottomed, you are swimming upstream with the odds stacked against you. Those odds may change, but as of now there is no credible evidence to support a bullish bet yet on stocks.
At Some Point Nothing Else Matters Except Protecting Principal
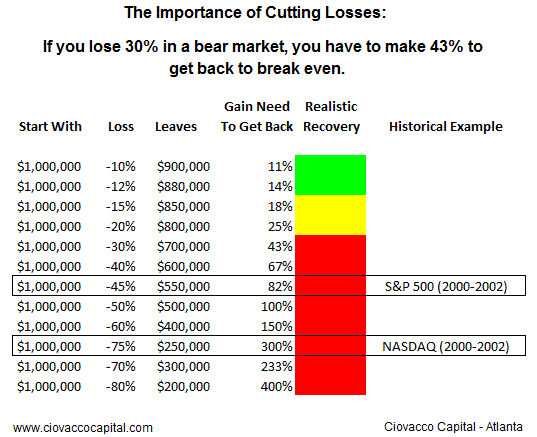
When asked their secrets of success, money managers who consistently have been top performers almost without exception state the importance of "cutting losses and letting winners run." Similarly, when the best professional managers are asked to name common mistakes made by individual investors, they typically put the failure to cut losses at the top of the list. The cruel reality of the markets is when you lose 30% you need to make more than 30% to get back to break even. As the chart below shows, if you lose 30%, you need to make 43% to get back to break even.
The two boxed rows show the danger of “staying the course” while bear markets destroy your hard earned principal. If you "rode out" the 2000-2002 bear market in the S&P 500 Index, your losses from peak to trough would have been roughly 45%. To get back to break even, you would have needed to earn an 82% return from the bottom which was made in October of 2002. When losses begin to pile up, at some point you have to put both the fundamentals and charts on the back burner and focus on preserving principal in order to have the opportunity to fight another day.
The previous statements and charts are not meant to be forecasts, but simply an assessment of current risk/reward profiles and probabilities as we see them. If the odds shift to more favorable or alternate outcomes, we are keeping an open mind and will gladly adjust our thinking as new evidence unfolds.
By Chris Ciovacco
Ciovacco Capital Management
Copyright (C) 2008 Ciovacco Capital Management, LLC All Rights Reserved.
Chris Ciovacco is the Chief Investment Officer for Ciovacco Capital Management, LLC. More on the web at www.ciovaccocapital.com
Ciovacco Capital Management, LLC is an independent money management firm based in Atlanta, Georgia. As a registered investment advisor, CCM helps individual investors, large & small; achieve improved investment results via independent research and globally diversified investment portfolios. Since we are a fee-based firm, our only objective is to help you protect and grow your assets. Our long-term, theme-oriented, buy-and-hold approach allows for portfolio rebalancing from time to time to adjust to new opportunities or changing market conditions. When looking at money managers in Atlanta, take a hard look at CCM.
All material presented herein is believed to be reliable but we cannot attest to its accuracy. Investment recommendations may change and readers are urged to check with their investment counselors and tax advisors before making any investment decisions. Opinions expressed in these reports may change without prior notice. This memorandum is based on information available to the public. No representation is made that it is accurate or complete. This memorandum is not an offer to buy or sell or a solicitation of an offer to buy or sell the securities mentioned. The investments discussed or recommended in this report may be unsuitable for investors depending on their specific investment objectives and financial position. Past performance is not necessarily a guide to future performance. The price or value of the investments to which this report relates, either directly or indirectly, may fall or rise against the interest of investors. All prices and yields contained in this report are subject to change without notice. This information is based on hypothetical assumptions and is intended for illustrative purposes only. THERE ARE NO WARRANTIES, EXPRESSED OR IMPLIED, AS TO ACCURACY, COMPLETENESS, OR RESULTS OBTAINED FROM ANY INFORMATION CONTAINED IN THIS ARTICLE. PAST PERFORMANCE DOES NOT GUARANTEE FUTURE RESULTS.
Chris Ciovacco Archive |
© 2005-2022 http://www.MarketOracle.co.uk - The Market Oracle is a FREE Daily Financial Markets Analysis & Forecasting online publication.


