


2 Charts That Might Define the Fed’s Jerome Powell Era
Stock-Markets / US Federal Reserve Bank Dec 13, 2017 - 06:27 PM GMTBy: F_F_Wiley

 In September, we proposed a theory of the Fed and suggested that the FOMC will soon worry mostly about financial imbalances without much concern for recession risks. We reached that conclusion by simply weighing the reputational pitfalls faced by the economists on the committee, but now we’ll add more meat to our argument, using financial flows data released last week. We’ve created two charts, beginning with a look at cumulative, inflation-adjusted asset gains during the last seven business cycles:
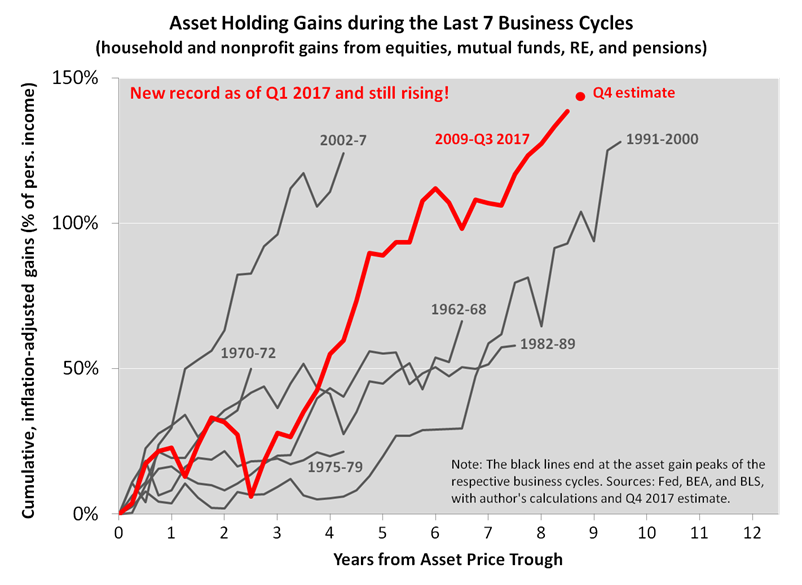
According to the way that the Fed defines its policy approach, our first chart stamps a giant “Mission Accomplished” on the unconventional policies of recent years. Recall that policy makers explained their actions with reference to the portfolio balance channel, meaning they were deliberately enticing investors to buy riskier assets than they would otherwise hold. Policy makers hoped to push asset prices higher, and they seem to have succeeded, notwithstanding the usual debates about how much of the price gains should be attributed to central bankers. (See one of our contributions here and a couple of other papers here and here.) But whatever the impetus for assets to rise, it’s obvious that they responded. In fact, judging by the data shown in the chart, policy makers could have checked the higher-asset-prices box long ago, and with a King Size Sharpie.
Consider the measure on the vertical axis, percent of personal income. From the risky asset trough in Q1 2009 through Q3 2017, households accumulated asset gains, in real terms, equivalent to 139% of personal income. (Nominal gains were much greater, but we used the CPI to deduct the amount of purchasing power that households lost on their asset holdings. Also, we defined asset holdings as the four biggest categories that the Fed computes gains for—equities, mutual funds, real estate, and pensions.)
In other words, households are enjoying an investment windfall that amounts to nearly sixteen months of personal income, which is larger than the windfalls accrued in any other business cycle since the Fed began tracking asset gains in 1947. Not only that but the gap continues to widen—as of this writing, we’re likely approaching 145% of personal income and well clear of the previous peak of 128% from the 1991–2001 expansion.
Getting back to policy priorities, the chart seems to tell us that asset prices no longer need boosting. The Fed’s pooh-bahs proved they could boss the investment markets, and they’ve almost certainly moved on to new endeavors.
Bull, bear, or donkey?
But record asset gains are just one of the reasons the Fed’s priorities are likely to be changing. To describe another reason, we’ll first show that policy makers may wield a King Size Sharpie but that it’s not a Permanent Marker:
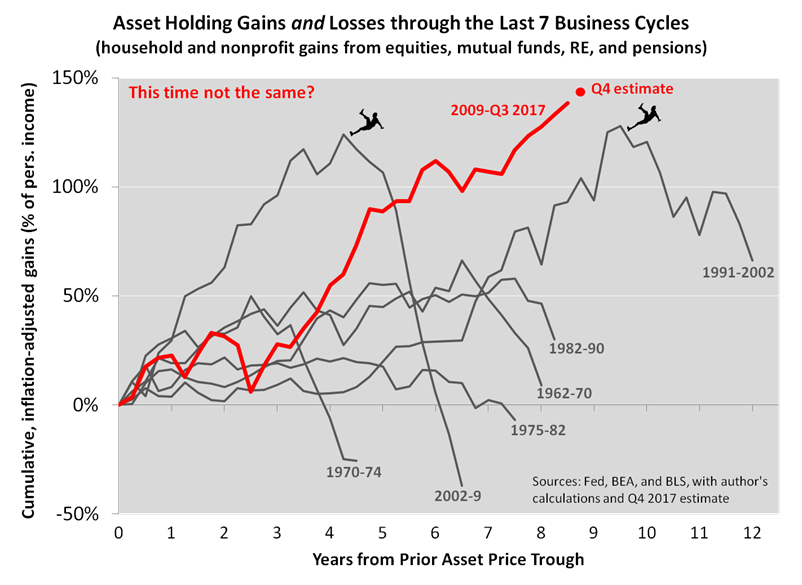
As you can see, our second chart looks like the first, except that we pinned the tails on the asset price donkeys. We tacked on the down halves of each cycle, showing that the portfolio balance channel has a reverse mode.
So what should we make of the result that asset price cycles, adjusted for inflation, have ended with busts that reverse a large portion and often the entirety of the prior booms?
According to our beliefs about how investment markets work, the up and down phases of asset cycles are closely connected. Also, monetary stimulus influences both phases at the same time. It helped fuel the giant gains of recent expansions, but it also helped create the imbalances that led to giant losses. And after the accelerated advances of 2016-17, it’s fair to wonder if today’s imbalances are approaching the extremes of 2000 and 2007. Even some FOMC members are gently acknowledging that risk.
But we think the committee members are even more concerned than you would know by just reading their meeting minutes. We expect financial imbalances to become their biggest worry, bigger than the risk of recession, which should matter less and less to the central bankers’ reputations as the business cycle expansion continues to lengthen. In fact, a garden variety recession would barely affect their legacies at all by mid-2019, when the expansion, if still intact, would become the longest ever. By that time, the FOMC’s greatest reputational threat would be another financial market debacle, which would suggest that manipulating asset prices maybe wasn’t such a good idea, after all. In other words, the committee’s reputational calculus will change significantly during Jerome Powell’s first few years as chairperson.
All that said, Powell probably wants a recession-free economy in, say, his first year or two in the position. Moreover, he’ll certainly stress continuity with his predecessors’ policies. But once he becomes comfortable in the job, the Fed’s priorities will look nothing like they did under Janet Yellen and Ben Bernanke. Instead of fueling asset gains, Powell’s biggest challenge will be containing imbalances connected to prior gains. He and his peers will aim to avoid pinning another oversized tail on the donkey—or at least to manage the fallout from said tail—and that’s a challenge that could very well define his regime.
F.F. Wiley
F.F. Wiley is a professional name for an experienced asset manager whose work has been included in the CFA program and featured in academic journals and other industry publications. He has advised and managed money for large institutions, sovereigns, wealthy individuals and financial advisors.
© 2017 Copyright F.F. Wiley - All Rights Reserved
Disclaimer: The above is a matter of opinion provided for general information purposes only and is not intended as investment advice. Information and analysis above are derived from sources and utilising methods believed to be reliable, but we cannot accept responsibility for any losses you may incur as a result of this analysis. Individuals should consult with their personal financial advisors.
© 2005-2022 http://www.MarketOracle.co.uk - The Market Oracle is a FREE Daily Financial Markets Analysis & Forecasting online publication.