U.S. Dollar: Why It Pays to Use the Elliott Wave Model
Currencies / US Dollar Apr 07, 2018 - 05:06 PM GMTBy: EWI
See the signs that could’ve helped you nail two junctures in the greenback's trend
The legendary football coach Vince Lombardi believed that a winning team is built on mastering the game's basics -- so much so that at the start of the season he would "remind" veteran players, "Gentlemen, this is a football."
Lombardi would even take them out to the field, discuss the boundaries and remind the players that the goal is to get the football into the end zone.
This relentless review of the basics paid off. His team, the Green Bay Packers, won five championships, including the first Super Bowl.
It also pays to master the basics of Elliott wave analysis.
The basic Elliott wave pattern for financial markets is five waves in the direction of the main trend with corrections, i.e., moves against the trend, unfolding in three waves.
So, in an uptrend, prices would rise in five waves and fall in three waves. In a downtrend, prices would fall in fives and rise in three waves.
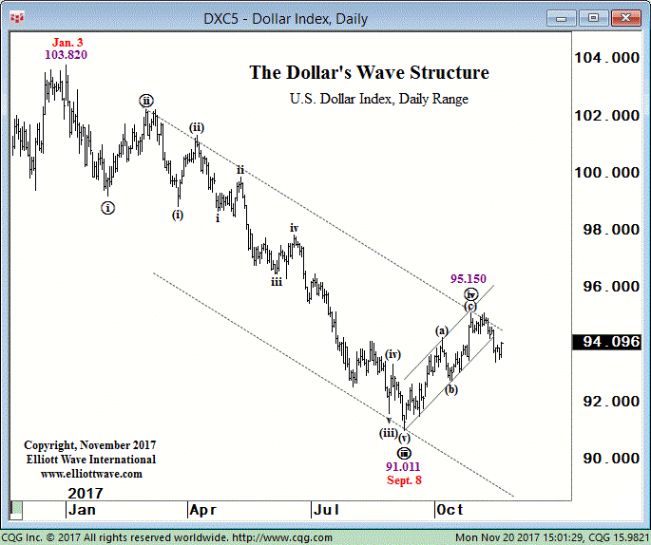
With that in mind, let's review how our U.S. Short Term Update editor made this bearish call on the U.S. Dollar Index last November.

The advance from the 91.011 low on September 8 to the 95.150 high on October 27 is still best labeled a three-wave structure. The implication of a three-wave advance is that the next-larger-degree of trend is down. So the dollar should eventually decline below 91.011 to complete the pattern from the January 3 high.
The Elliott wave "basics" delivered: That's exactly what happened.
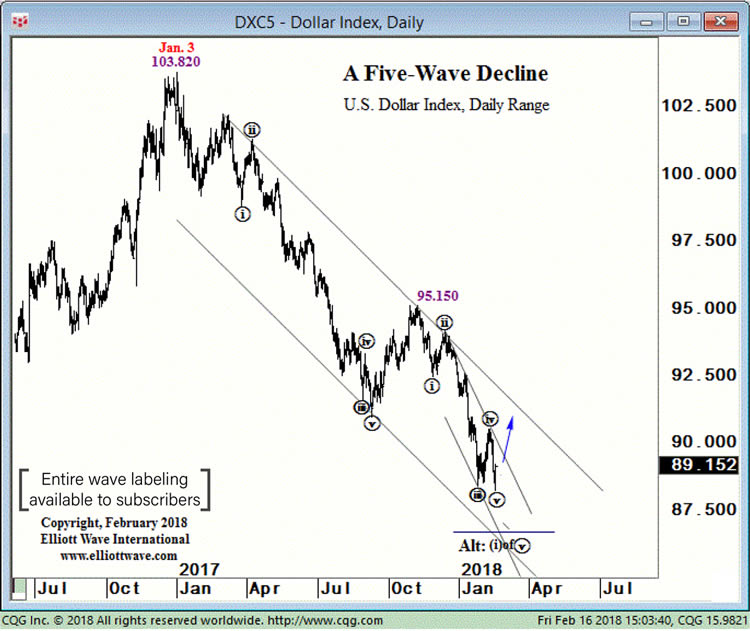
Look at this chart from the February 16, 2018 Short Term Update, which said:

The [U.S. Dollar Index] declined to 88.253 today, breaking below the wave iii (circle) low. Prices have satisfied the minimum expectations for wave v (circle) and we are now able to label wave v (circle) complete. In turn, a complete fifth wave also means the five-wave decline that started at the 103.820 high on January 3, 2017 is complete. Prices should now be starting the largest advance of the past 13 months.
Indeed, the U.S. Dollar Index began to rise from that very day.
As the March 28 Short Term Update noted:
The [U.S. Dollar Index] jumped sharply to 90.147 today in the largest one-day intraday rally in 5 months.
Interestingly, around the last week of March, a group of hedge funds held its largest net-short position in U.S. dollar futures and options since August 2011.
Will the hedge funds turn out to be right, is the dollar rally expected to reverse?
Maybe. But remember, crowd psychology at big market turns often reaches an extreme like that, which -- from a contrarian perspective -- only helps you to validate your "basic" Elliott wave analysis.
If you are prepared to take the next step in educating yourself about the basics of the Wave Principle -- access the FREE Online Tutorial from Elliott Wave International.
The Elliott Wave Basic Tutorial is a 10-lesson comprehensive online course with the same content you'd receive in a formal training class -- but you can learn at your own pace and review the material as many times as you like!
Get 10 FREE Lessons on The Elliott Wave Principle that Will Change the Way You Invest Forever.
This article was syndicated by Elliott Wave International and was originally published under the headline U.S. Dollar: Why It Pays to Use the Elliott Wave Model. EWI is the world's largest market forecasting firm. Its staff of full-time analysts led by Chartered Market Technician Robert Prechter provides 24-hour-a-day market analysis to institutional and private investors around the world.
© 2005-2022 http://www.MarketOracle.co.uk - The Market Oracle is a FREE Daily Financial Markets Analysis & Forecasting online publication.


