


Global Economic Tensions Translate Into Oil Price Volatility
Commodities / Crude Oil May 22, 2019 - 05:17 PM GMTBy: Chris_Vermeulen

 Our continued efforts to alert and assist fellow traders to the incredible setups that are currently happening throughout the globe with regards to increased global economic tensions are starting to take root. We are hearing from our readers and follower and we love the comments we are receiving. Near April/May 2018, we started predicting that the end of 2018 and almost all of 2019/2020 were going to include incredible opportunities for skilled traders. We made these predictions at about the same time that we issued a series of incredible calls regarding the future market moves in 2018 & 2019.
April 22, 2018: Predictive Modeling Is Calling For A Continued Rally https://www.thetechnicaltraders.com/our-advanced-predictive-modeling-is-calling-for-a-continued-rally/
May 8, 2018: If You Knew What We Knew… https://www.thetechnicaltraders.com/if-you-knew-what-we-knew/
September 17, 2018: Predictive Trading Model Suggests Falling Stock Prices During US Elections https://www.thetechnicaltraders.com/predictive-trading-model-suggests-falling-stock-prices-us-elections/
January 20, 2019: Will China Surprise The Market? https://www.thetechnicaltraders.com/china-surprises-the-us-stock-market/
Our most recent multiple-part research post regarding the current global economic environment and how EU elections, US/China trade issues and a very contentious US Presidential Election cycle are poised to continue driving increased price volatility just hit the digital medium last weekend (https://www.thetechnicaltraders.com/us-vs-global-sector-rotation-what-next-part-ii/ ). We urge all of our followers to read this detailed article about how a series of global events are stacking up to create incredible opportunities for skilled traders.
Today, we are focusing on Crude Oil because our proprietary adaptive learning Fibonacci modeling system is suggesting a surge of massive volatility is very likely to happen over the next few months in Crude Oil and we believe the DOWNSIDE price risk is the most likely outcome at this point. Fibonacci price theory dictates that price must ALWAYS attempt to seek out new price highs or new price lows – ALWAYS. We interpret this price requirement as the following:
“Tracking major price peaks and valleys, one can determine if the price is currently achieving new higher high price levels or lower low price levels (thus continuing the price trend) or failing to reach these new higher high or lower low levels. Any failure to reach new higher highs or lower lows is a warning that price may be attempting to continue a previous price trend or reversing.”
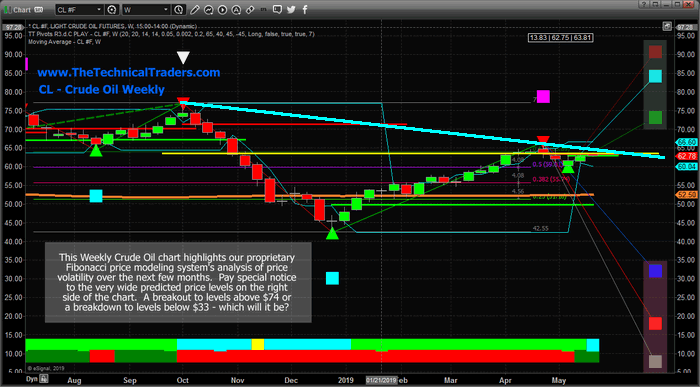
This Weekly chart of Crude Oil clearly illustrates our thinking in terms of this Fibonacci price theory component and other technical aspects. The CYAN price trend line (downward sloping) suggests a failure to establish any new price highs over the longer term trend. Additionally, the recent downward price rotation suggests price weakness may be returning to Crude Oil. Pay very special attention to the Fibonacci price projection levels on the right side of this chart. Notice that the upside price projections start near $74 and the downside price projections start near $33. This is an incredible $41 price range in Crude Oil and this very wide Fibonacci projection range suggests massive volatility is about to hit.
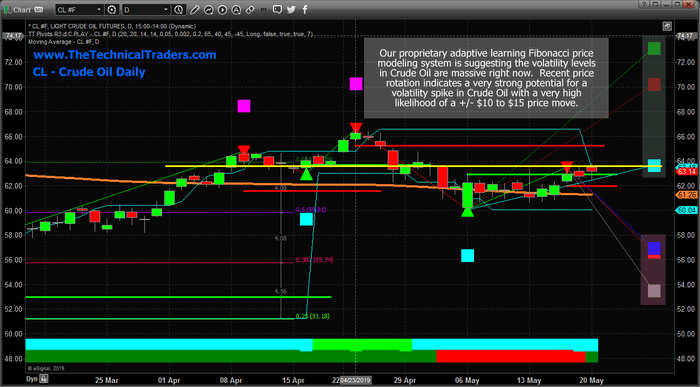
This Daily Crude Oil chart showing our proprietary Fibonacci price modeling system’s results also suggests incredible upside and downside price projections. The upside levels target the current price level (near $63.50) as well as additional levels above $70. The downside levels target a range of lower price objectives between $53 and $57. The current Fibonacci price target level (CYAN) is quite interesting as it suggests Oil prices will find resistance near $63.50 and potentially move lower if this upside price trend fails.
Therefore, we take the entire analysis into consideration and come to the following conclusion:
If price falls below the $64 level and begins to move below $61.85 (the Daily Fibonacci Bearish Trigger Level), then we would consider the current upside price trend to have “failed” in attempting to reach a “new higher high” level (which would require price to move to levels above $66.60). This conclusion would suggest that the failure of the upside price move should prompt a downside price move attempting to take out the $60.07 lows (attempting to establish a “new lower low” price level).
The longer-term downward sloping price channel suggests the failure to achieve recent higher price highs is indicative of a failed rally attempt which will prompt a new downside price move in the near future. The only condition that could reverse this analysis is if Oil prices rallied above $66.60 and attempted to break the longer term price channel.
It is our opinion that Crude Oil will attempt a move lower, attempting to breach the $60.07 low price level and attempt a move back to levels near $55 to $56 before finding support. This current rotation in price is a process of setting up a downward sloping Pennant/Flag formation (we believe). Global economic factors, being what they are right now, are likely to see increased supply and decreased demand for Oil across the planet – at least until more clarity and resolution is established with the US/China trade issues and the US Presidential elections.
Get ready for a big move in Crude Oil. Our analysis suggests the move will be to the downside with a downside target between $53 and $55 right now. Any further price expectations will be updated as we get further information from our proprietary price modeling systems. Remember, any new conflicts/wars with Iran or in the Middle East will push Oil prices much higher and negate the technical analysis/supply/demand price analysis we’ve presented. We would not like to see any conflicts happen, but we have to be aware that this reality exists and that Oil could rally well past $70 if a new conflict occurred.
If you want to follow the exact trades I take while learning to read the charts and make money be sure to join my Wealth Trading Newsletter today!
Chris Vermeulen
www.TheTechnicalTraders.com
Chris Vermeulen has been involved in the markets since 1997 and is the founder of Technical Traders Ltd. He is an internationally recognized technical analyst, trader, and is the author of the book: 7 Steps to Win With Logic
Through years of research, trading and helping individual traders around the world. He learned that many traders have great trading ideas, but they lack one thing, they struggle to execute trades in a systematic way for consistent results. Chris helps educate traders with a three-hour video course that can change your trading results for the better.
His mission is to help his clients boost their trading performance while reducing market exposure and portfolio volatility.
He is a regular speaker on HoweStreet.com, and the FinancialSurvivorNetwork radio shows. Chris was also featured on the cover of AmalgaTrader Magazine, and contributes articles to several leading financial hubs like MarketOracle.co.uk
Disclaimer: Nothing in this report should be construed as a solicitation to buy or sell any securities mentioned. Technical Traders Ltd., its owners and the author of this report are not registered broker-dealers or financial advisors. Before investing in any securities, you should consult with your financial advisor and a registered broker-dealer. Never make an investment based solely on what you read in an online or printed report, including this report, especially if the investment involves a small, thinly-traded company that isn’t well known. Technical Traders Ltd. and the author of this report has been paid by Cardiff Energy Corp. In addition, the author owns shares of Cardiff Energy Corp. and would also benefit from volume and price appreciation of its stock. The information provided here within should not be construed as a financial analysis but rather as an advertisement. The author’s views and opinions regarding the companies featured in reports are his own views and are based on information that he has researched independently and has received, which the author assumes to be reliable. Technical Traders Ltd. and the author of this report do not guarantee the accuracy, completeness, or usefulness of any content of this report, nor its fitness for any particular purpose. Lastly, the author does not guarantee that any of the companies mentioned in the reports will perform as expected, and any comparisons made to other companies may not be valid or come into effect.
Chris Vermeulen Archive |
© 2005-2022 http://www.MarketOracle.co.uk - The Market Oracle is a FREE Daily Financial Markets Analysis & Forecasting online publication.