


Is Stock Market About to Crash? Three Charts That Suggest It’s Possible
Stock-Markets / Stock Market Crash Aug 17, 2019 - 07:19 PM GMTBy: Graham_Summers

 Things are worsening quickly now.
The S&P 500 has failed to recover its 50-day moving average (red line). Even worse, the 13-day moving average (blue line) has staged a bearish cross with the 50-day moving average, signaling DOWNWARDS momentum is building.
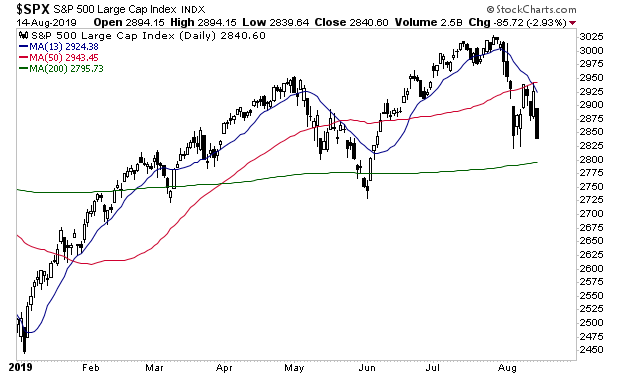
This suggests a move to the 200-day moving average (green line) at 2,800 will be occurring soon. If that line doesn’t hold, we’re in REAL trouble.
How bad?
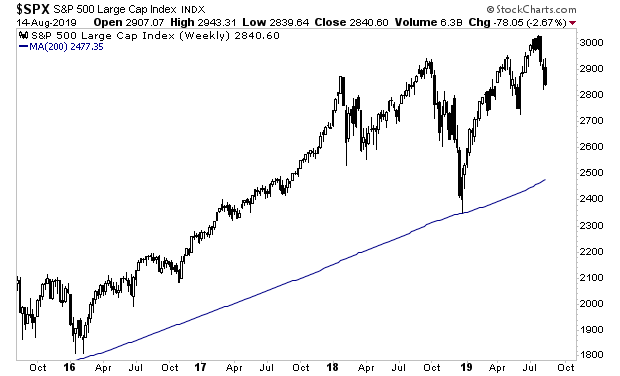
The “line in the sand” for the stock market is the 200-WEEK moving average. If we cannot hold the 200-DAY moving average, we’re heading to this line.
Unfortunately that’s where Copper, Bond Yields, and Fed Ex, all of them real-world economic indicators, indicate that stocks are heading.
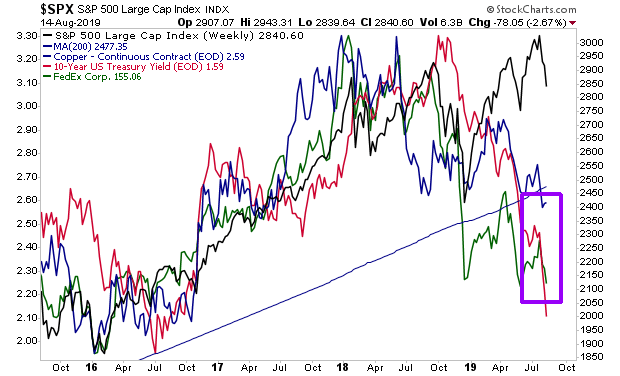
This is telling us stocks are going DOWN, possibly quite a lot.
On that note, we are already preparing our clients for this with a 21-page investment report titled the Stock Market Crash Survival Guide.
In it, we outline the coming collapse will unfold…which investments will perform best… and how to take out “crash” insurance trades that will pay out huge returns during a market collapse.
Today is the last day this report will be available to the general public.
To pick up one of the last remaining copies…
https://www.phoenixcapitalmarketing.com/stockmarketcrash.html
Graham Summers
Phoenix Capital Research
http://www.phoenixcapitalmarketing.com
Graham also writes Private Wealth Advisory, a monthly investment advisory focusing on the most lucrative investment opportunities the financial markets have to offer. Graham understands the big picture from both a macro-economic and capital in/outflow perspective. He translates his understanding into finding trends and unde74rvalued investment opportunities months before the markets catch on: the Private Wealth Advisory portfolio has outperformed the S&P 500 three of the last five years, including a 7% return in 2008 vs. a 37% loss for the S&P 500.
Previously, Graham worked as a Senior Financial Analyst covering global markets for several investment firms in the Mid-Atlantic region. He’s lived and performed research in Europe, Asia, the Middle East, and the United States.
© 2019 Copyright Graham Summers - All Rights Reserved Disclaimer: The above is a matter of opinion provided for general information purposes only and is not intended as investment advice. Information and analysis above are derived from sources and utilising methods believed to be reliable, but we cannot accept responsibility for any losses you may incur as a result of this analysis. Individuals should consult with their personal financial advisors.
Graham Summers Archive |
© 2005-2022 http://www.MarketOracle.co.uk - The Market Oracle is a FREE Daily Financial Markets Analysis & Forecasting online publication.