


Crude Oil Price Reverses Lower Again After US Missile Attack
Commodities / Crude Oil Jan 07, 2020 - 08:00 AM GMTBy: Chris_Vermeulen

Normally, after tensions between Iran/Iraq and the US flare-up, Oil and Gold rally quite extensively but reversed sharply lower by the end of the session.
Yes, Gold is 1% higher today and was up over $35 overnight, but Crude Oil has actually moved lower today which is a fairly strong indication that disruptions in oil supply from the Middle East are not as concerning as they were 10+ years ago. Traders and investors don’t believe this isolated targeted missile attack will result in any extended aggression between the US and Iran.
When past conflicts in the Middle East happened, Oil would typically rally and Gold would spike higher as well. Consider this a reflex action to uncertain oil supply issues and concerns that global market uncertainty could crash the markets. Gold seems like an easy expectation related to this type of uncertainty as it continues to act as a hedge against many risks like missiles/war, financial uncertainties etc…
In my pre-market video report to subscribers today (Monday, Jan 6th) I pointed out how the price of crude oil was testing a critical resistance area form the last time there were missiles fired. Today’s reversal is not a huge surprise and in fact, it looks like an exhaustion top.
Oil, on the other hand, has experienced one of the longer price declines in recent history, from the peak price near $147 near July 2008 to levels currently near $63. But we saw a low price for oil below $30 (near February 2016).
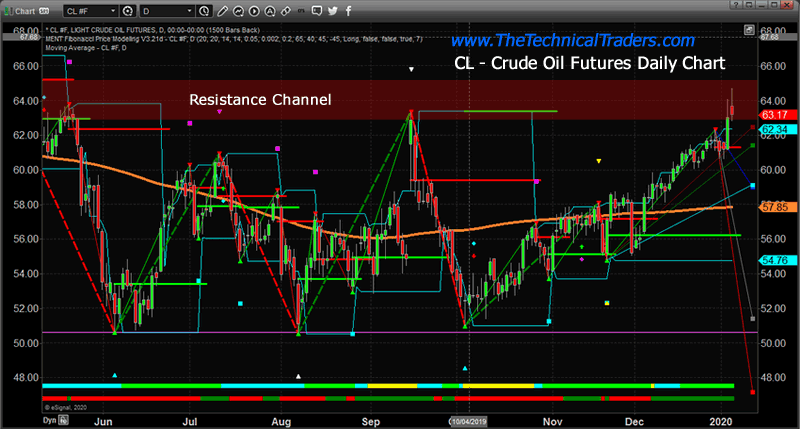
Crude Oil Daily Chart
I believe a technical resistance channel may be pushing Oil prices lower today as the price has continued to rotate lower after moving into this extended Resistance Channel. It may be that global traders don’t believe this conflict with Iran will result in any type of massive oil supply disruption or risk for the global markets right away. The Resistance Channel, between $63 and $65.50, has continued to act as a price ceiling over the past 7+ months.
Crude Oil Weekly Chart
Our proprietary Fibonacci Price Modeling system is highlighting similar levels near $64 and $50. This price modeling system maps and tracks price rotation using a proprietary adaptive Fibonacci price theory model. These levels, highlighted on this chart, represent immediate price target levels for any upside move (CYAN, already reached) and any downside move (BLUE, suggesting a move back towards $50 may be in the works).
If Oil is not capable of breaking above this Resistance Channel, then Fibonacci Price Theory would suggest price must turn lower and attempt to establish a new LOW PRICE level that is below recent low price levels.
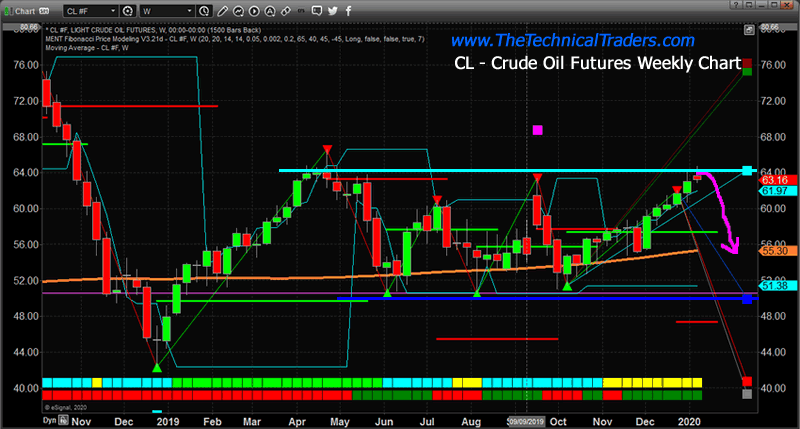
If this Resistance Channel continues to act as a solid price ceiling, Crude Oil may turn lower over the first few quarters of 2020 and attempt to target levels near or below $50 fairly soon. Skilled traders should prepare for this type of move and identify opportunities for profits in the near future.
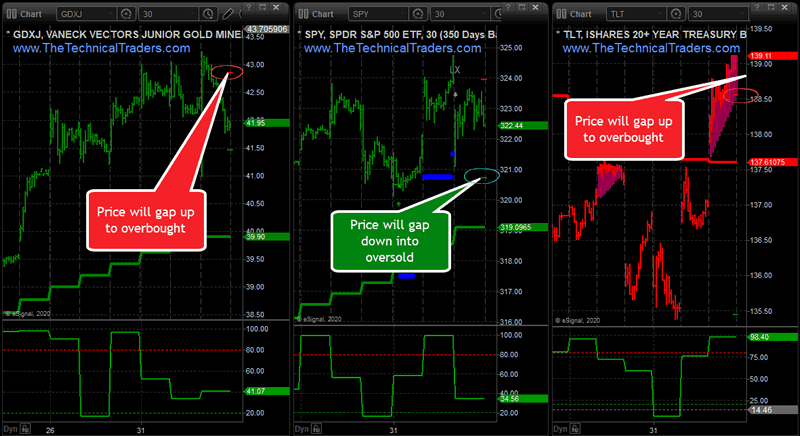
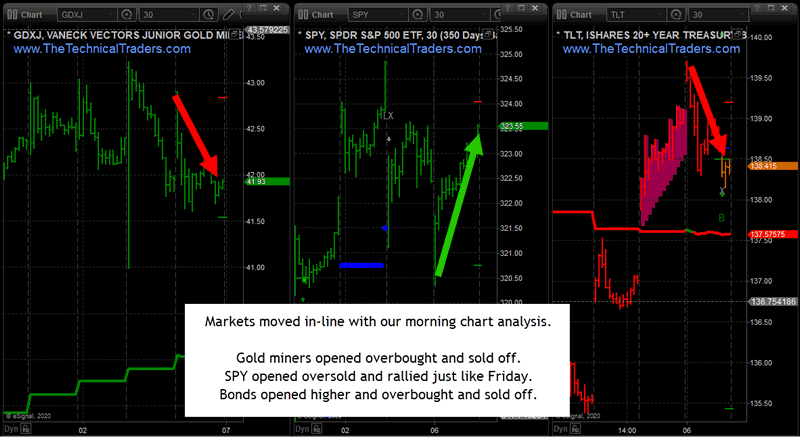
In fact, I also gave subscribers a head up that GDXJ and TLT were going to gap higher and likely be under pressure all session. Also, I showed how the SP500 was going to gap lower deep into oversold territory and likely rally strongly just like last Friday, all of these things happened perfectly today.
Pre-market GDXJ, SPY, TLT warning of price gaps into extreme territories beyond the small colored lines: Red (overbought level), and Green (oversold level)
Pre-Market Chart Analysis
End Of Day Market Movements
My point is my team and I have a good pulse on the major markets and can profit during times when most others can’t which is why you should join my Wealth Trading Newsletter for index, metals, and energy trade alerts. Visit our website to learn how you can see what this research is telling us.
I am going to give away and ship out silver and gold rounds to anyone who buys a 1-year, or 2-year subscription to my Wealth Trading Newsletter. You can upgrade to this longer-term subscription or if you are new, join one of these two plans listed below, and you will receive:
1oz Silver Round FREE 1-Year Subscription
1/2 Gram Gold Bar FREE 2-Year Subscription
SUBSCRIBE TO MY TRADE ALERTS AND
Free Shipping!
Chris Vermeulen
www.TheTechnicalTraders.com
Chris Vermeulen has been involved in the markets since 1997 and is the founder of Technical Traders Ltd. He is an internationally recognized technical analyst, trader, and is the author of the book: 7 Steps to Win With Logic
Through years of research, trading and helping individual traders around the world. He learned that many traders have great trading ideas, but they lack one thing, they struggle to execute trades in a systematic way for consistent results. Chris helps educate traders with a three-hour video course that can change your trading results for the better.
His mission is to help his clients boost their trading performance while reducing market exposure and portfolio volatility.
He is a regular speaker on HoweStreet.com, and the FinancialSurvivorNetwork radio shows. Chris was also featured on the cover of AmalgaTrader Magazine, and contributes articles to several leading financial hubs like MarketOracle.co.uk
Disclaimer: Nothing in this report should be construed as a solicitation to buy or sell any securities mentioned. Technical Traders Ltd., its owners and the author of this report are not registered broker-dealers or financial advisors. Before investing in any securities, you should consult with your financial advisor and a registered broker-dealer. Never make an investment based solely on what you read in an online or printed report, including this report, especially if the investment involves a small, thinly-traded company that isn’t well known. Technical Traders Ltd. and the author of this report has been paid by Cardiff Energy Corp. In addition, the author owns shares of Cardiff Energy Corp. and would also benefit from volume and price appreciation of its stock. The information provided here within should not be construed as a financial analysis but rather as an advertisement. The author’s views and opinions regarding the companies featured in reports are his own views and are based on information that he has researched independently and has received, which the author assumes to be reliable. Technical Traders Ltd. and the author of this report do not guarantee the accuracy, completeness, or usefulness of any content of this report, nor its fitness for any particular purpose. Lastly, the author does not guarantee that any of the companies mentioned in the reports will perform as expected, and any comparisons made to other companies may not be valid or come into effect.
Chris Vermeulen Archive |
© 2005-2022 http://www.MarketOracle.co.uk - The Market Oracle is a FREE Daily Financial Markets Analysis & Forecasting online publication.