Stock Market Into 2021
Stock-Markets / Stock Markets 2020 Dec 17, 2020 - 03:49 PM GMTBy: Donald_W_Dony
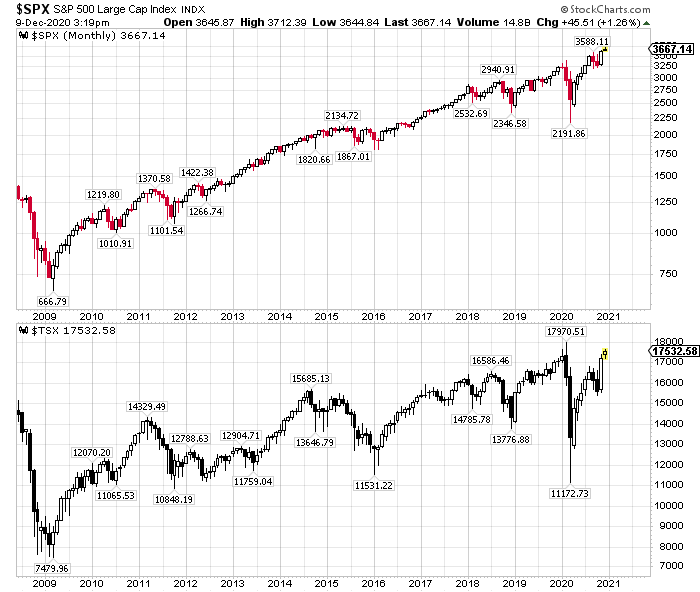
Markets continue to show no signs of concern as new highs develop
in Q4 and bullish trends hold (Chart 1). The S&P 500 recently posted a new all-time high of 3588.11 and the TSX is retested an all-time high near 18,000.

Another welcoming sign for markets in 2021 are the sectors in the benchmark S&P 500. The industry groups that are performing best over the last 90 days are a promising sight. Industrials, Financials, Base metals, Consumer Discretionary and Communication services are all outperforming the S&P 500 (Chart 2). The bottom four sectors are all safe haven groups. Real Estate, Utilities, Health Care and Consumer staples are all defensive industry groups. The market is moving away from these “risk-off” groups and staying with “risk-on” sectors. The same action applies to fixed income. The market has been steadily moving away from bonds in Q4 (another safe haven security) and going for growth (stocks).
.jpg)
The recent rise in performance from the Base metals sector is an indication of how advance the market cycle is. Base/Industrial metals (i.e. copper, zinc, lead and nickel) normally start to perform well about halfway through a market cycle. As the bull market has progressed for about 11 years and that, on average, secular bull markets continue for about 18 years (i.e. 1920 to 1930, 1950 to 1970 and 1982 to 2000) this advance in performance from the base metals sector is like a road sign signally that there is more upside coming for the stock market.
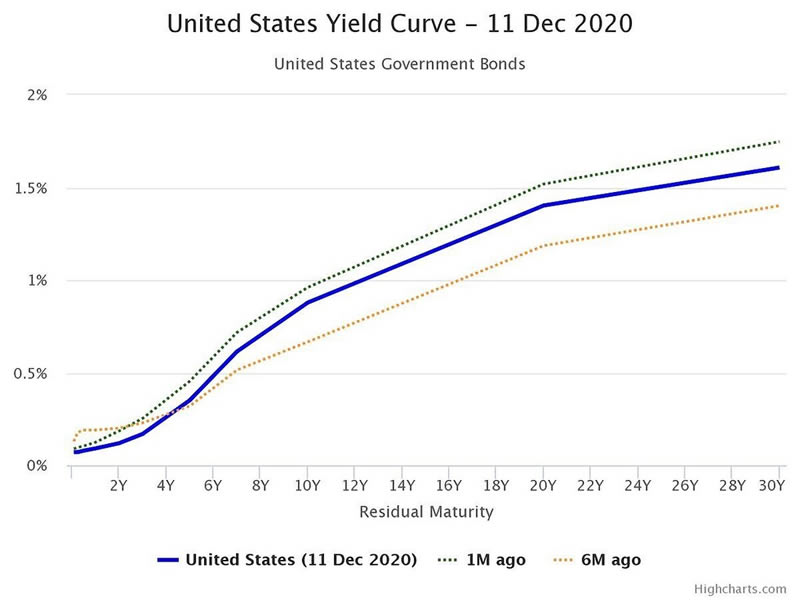
Another key indicator of market duration is the U.S. Yield Curve (Chart 3). This economic indicator has an unblemished history of leading the stock market since the 1940s. At this junction, the curve is in a normal position with short-term rates lower than long-term. This action indicates that the Fed has room to accommodate upside growth in the economy and control expansion. A signal that the economy and market are near the end of their growth is when short-term rates are near or above long-term rates.

Bottom line: The current bull market is showing no signs of exhaustion as it enters into a new year. The long-term trend, the "risk-on" sector strength performance and the position of the U.S. Yield Curve all highlight and reinforce the positive outlook in 2021.
Our models point to 4,135 as the target for the S&P 500 and 19,000 for the TSX.
By Donald W. Dony, FCSI, MFTA
www.technicalspeculator.com
COPYRIGHT © 2020 Donald W. Dony
Donald W. Dony, FCSI, MFTA has been in the investment profession for over 20 years, first as a stock broker in the mid 1980's and then as the principal of D. W. Dony and Associates Inc., a financial consulting firm to present. He is the editor and publisher of the Technical Speculator, a monthly international investment newsletter, which specializes in major world equity markets, currencies, bonds and interest rates as well as the precious metals markets.
Donald is also an instructor for the Canadian Securities Institute (CSI). He is often called upon to design technical analysis training programs and to provide teaching to industry professionals on technical analysis at many of Canada's leading brokerage firms. He is a respected specialist in the area of intermarket and cycle analysis and a frequent speaker at investment conferences.
Mr. Dony is a member of the Canadian Society of Technical Analysts (CSTA) and the International Federation of Technical Analysts (IFTA).
Donald W. Dony Archive |
© 2005-2022 http://www.MarketOracle.co.uk - The Market Oracle is a FREE Daily Financial Markets Analysis & Forecasting online publication.


