


Stock Market Probing Short-term Bottom in a Long-term Bear Market
Stock-Markets / Stocks Bear Market Oct 19, 2008 - 06:36 PM GMTBy: Andre_Gratian

 Current Position of the Market
Long-term trend - Down! The very-long-term cycles have taken over earlier than anticipated and if they make their lows when expected, the bear market which started in October 2007 should continue until 2012-2014.
SPX: Intermediate trend - Look for a low in early to mid-October, with a possible extension to November as the best possibility for the end of the first phase of the bear market.
Analysis of the short-term trend is done on a daily basis with the help of hourly charts. It is an important adjunct to the analysis of daily and weekly charts which discusses the course of longer market trends.
Daily market analysis of the short term trend is reserved for subscribers. If you would like to sign up for a FREE 4-week trial period of daily comments, please let me know at ajg@cybertrails.com .
Overview:
Since October 1st, the SPX lost 319 points before rebounding, and the Dow industrials almost 3000 points. In the past week, large daily swings have taken place with no follow through in either direction.
Have we found a low? Definitely not for the long term since, according to the long-term cycles, this bear market still has several years to go and is prognosticating a deep and prolonged recession. Incidentally, there was a typo in the last newsletter. Reference was made to the 100 year cycle bottoming in 2012-14. It should have read the 120-year cycle.
The short-term and the intermediate-term trends are still undecided, but many signs point to the necessity for one more low, at least in the latter, and perhaps in the former as well. Next week would be a possibility for a final (short-term) low. The other would be in November.
The massive amount of money injected into the system by the Federal Reserve and the Treasury, as well as the positive steps taken by many governments around the world, may be beginning to have an effect. The Ted spread has declined about a point to 3.63 in the last week, but is still considerably above its normal reading of 1.00 or less. This shows that credit may be starting to loosen and this should begin to restore confidence. After forced liquidations have ceased or diminished, the market should be in a position to recover some of its losses.
What's ahead?
Chart pattern and momentum:
The channel shown here with the brown trend lines probably best represents the intermediateterm trend. Overcoming the top trend line is going to require a lot of preliminary work.
On 10/10, the SPX went to the bottom of the channel and rebounded. So far, the only down trend line which has been overcome is the steepest one (green channel). It has challenged the black trend line on its first rally, and was pushed back. On its second challenge, which came on Friday, it was pushed back again. The next challenge should be able to make it through. This is why next week is a very important week.
The A/D oscillator has already pushed out of its channel line, and the MSO is on the verge of doing so. If we start up on Monday morning and close positive, we will most likely trigger a short-term buy signal. If we have a down day instead, there is a good chance that we could see a new low.
Triggering a short-term buy signal would defer new lows until later in October, or November.
Cycles
I held on as long as I could to the idea that the 6-yr cycle would only provide an intermediate low, but that was not to be. The 120-yr cycle is already exerting tremendous down pressure and causing massive economic chaos. Since it is not due to make its low until 2012-14, I don't look forward to the prospect of what lies ahead for the world's economies. I hope sincerely that we have the wisdom and the means to prevent a depression.
There won't be a decennial pattern in which the stock market makes its high in the 9th or 10th year of the decade this time, although, some sort of an intermediate rally into that time frame is possible before the final plunge to the long-term lows.
The next cycle of importance is the 9-mo cycle which is due in mid-November, and this would seem the best timing for the next low in the stock market, if we have not made some serious upside progress before then. However, we should be aware that this cycle's phase is not that regular and can vary in length by a couple of weeks.
The 20-wk cycle has probably already bottomed and should not be a factor.
The next minor cycle is due to make its low about 10/22
Projections:
The volatility of the market is resulting in many projections, as levels are broken both up and down. I'll just mention a few.
On Friday, the SPX reached a short-term projection and pulled-back to 941. If it breaks below 940, it will trigger a projection to about 920. That level must hold or we could keep on going to make new lows.
Breaking below 890, could take it to 845, and perhaps 805.
If 940 holds and we rise above 983, the next target would take the index above 1000 again.
Breadth
By dropping to a new low, the NYSE Summation Index (below, courtesy of StockCharts) is telling us that we probably have lower to go, even for a bottom of intermediate nature. But by being so oversold, it is also signaling that we are close to a reversal.
The daily A/D oscillator in the SPX chart above is showing some good divergence to the price indicator, and it has already come outside of its down-channel. If the momentum oscillator joins it, we will have a short-term buy signal.
One should note that the A/D closed positive on Friday while the market was down. This is a form of positive divergence and may be meaningful for Monday's trend.
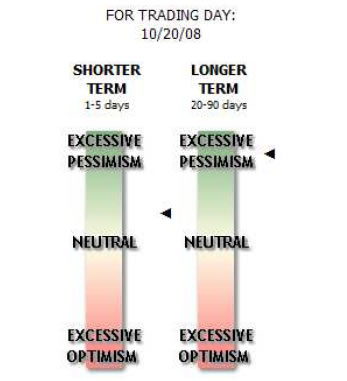
Market Leaders and Sentiment
The sentiment indicator (courtesy Sentiment Trader) is very bullish intermediate term and moderately bullish short term.
Another sign that we are at or approaching an important low: The NDX is beginning to outperform the SPX on a relative basis.
Summary
The decline of the past two weeks is confirming that we have started a bear market which is likely to continue for several more years.
The SPX is probing for a bottom, but structure strongly suggests that one more low is needed before we can have a rally that will last several weeks instead of the one or two-day rebounds that have been taken place recently.
The following are examples of unsolicited subscriber comments:
What is most impressive about your service is that you provide constant communication with your subscribers. I would highly recommend your service to traders. D.A.
Andre, you did it again! Like reading the book before watching the movie. B.F.
I would like to thank you so much for all your updates/newsletters. As I am mostly a short-term trader, your work has been so helpful to me as I know exactly when to get in and out of positions. I am so glad I decided to subscribe to Turning Points… Please rest assured that I shall continue to be with Turning Points for a long time to come. Thanks once again! D.P.
But don't take their word for it! Find out for yourself with a FREE 4-week trial. Send an email to ajg@cybertrails.com .
By Andre Gratian
MarketTurningPoints.com
A market advisory service should be evaluated on the basis of its forecasting accuracy and cost. At $25.00 per month, this service is probably the best all-around value. Two areas of analysis that are unmatched anywhere else -- cycles (from 2.5-wk to 18-years and longer) and accurate, coordinated Point & Figure and Fibonacci projections -- are combined with other methodologies to bring you weekly reports and frequent daily updates.
“By the Law of Periodical Repetition, everything which has happened once must happen again, and again, and again -- and not capriciously, but at regular periods, and each thing in its own period, not another’s, and each obeying its own law … The same Nature which delights in periodical repetition in the sky is the Nature which orders the affairs of the earth. Let us not underrate the value of that hint.” -- Mark Twain
You may also want to visit the Market Turning Points website to familiarize yourself with my philosophy and strategy.www.marketurningpoints.com
Disclaimer - The above comments about the financial markets are based purely on what I consider to be sound technical analysis principles uncompromised by fundamental considerations. They represent my own opinion and are not meant to be construed as trading or investment advice, but are offered as an analytical point of view which might be of interest to those who follow stock market cycles and technical analysis.
Andre Gratian Archive |
© 2005-2022 http://www.MarketOracle.co.uk - The Market Oracle is a FREE Daily Financial Markets Analysis & Forecasting online publication.