


USDX, Gold Miners: The Lion and the Jackals
Commodities / Gold and Silver Stocks 2021 May 06, 2021 - 12:22 PM GMTBy: P_Radomski_CFA

The USD Index let out a roar heard across all markets. The king of the financial jungle arrived, along with the greenback’s largest single-day gain.
Just as the African landscape sometimes needs to show the strongest of its inhabitants, so does the less remote but equally ferocious financial environment. This time, the USDX seems to have won the fight – its fangs and claws turned out to be the sharpest, and so are the rallies. There is nothing left for gold and its acquaintances than to run through the forest… run.
Sometimes, even jackals need to find shelter to lick their wounds in patience, waiting for a better time to come back to fight. However, they will come back eventually – they always do.
What About Gold, One of the Jackals?
With a triple-top in gold’s stochastic oscillator akin to three warning signs of a nervous breakdown, the yellow metal is still recovering from last week’s crisis of confidence. And with the price action mirroring what we witnessed in early January – right before gold suffered a significant slide – the yellow metal could soon need therapy.
Please see below:
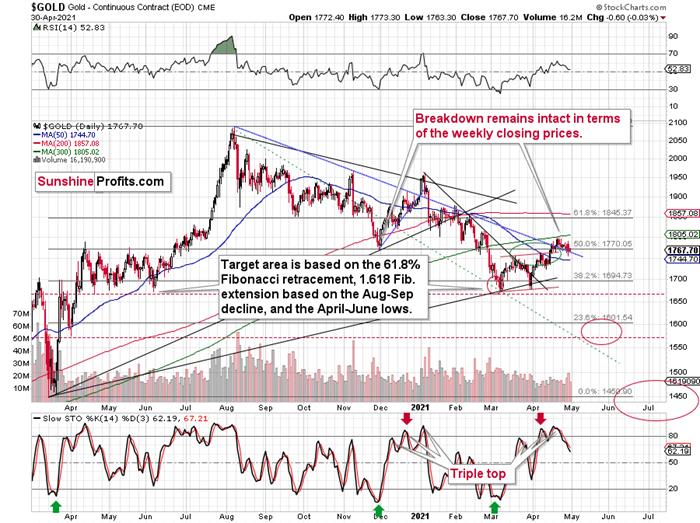
To explain, while gold’s corrective upswing was slightly bigger than I had anticipated, please note that the length thereof was in tune with the border of the green ellipse I used to mark the likely upside target area. In other words, the recent rally was not a game-changer . The yellow metal’s inability to crack $1,800 highlights the medium-term implications that I’ve been warning about. As a result, it’s become increasingly clear that gold’s recent strength was nothing more than a short-term upswing within a medium-term downtrend.
For more on the significance of gold’s stochastic oscillator, I wrote previously:
The first sell signal occurred slightly below the 80 level, the second was above it, and the same was the case with the third one.
Since back in early 2021, the stochastic indicator moved to new highs – and so far it hasn’t – and since the USD Index might even move slightly lower before finding its short-term bottom, gold could move slightly higher on a temporary basis, before topping. Perhaps (there are no certainties on any market, but this seems quite possible in the near term) it would be the round nature of the $1,800 level and the 300-day moving average that’s very close to it that would trigger a reversal and another massive decline. From the medium-term point of view, another $20 rally doesn’t really matter. It’s the few-hundred-dollar decline that’s likely to follow that really makes the difference.
In addition, it seems that gold is moving in a way that’s somewhat similar to what we saw between mid-April 2020 and mid-June 2020. It’s trading sideways below $1,800 but above ~$1,660. Back in 2020, the range of the back-and-forth movement (size of the short-term rallies and declines) was bigger, but the preceding move was also more volatile, so it’s normal to expect smaller short-term volatility this year (at least during this consolidation).
Why is this particularly interesting? Because both consolidations (the mid-April 2020 – mid-June 2020 one and the March 2021 – today one) could be the shoulders of a broad head-and-shoulders pattern, where the mid-June 2020 – early-March 2021 performance would be the head. The breakdown below the neck level – at about $1,660 – would be extremely bearish in this case because the downside target based on the pattern is created based on the size of the head. The target based on this broad pattern would be at about $1,350 (I marked it with a thin dashed red line on the chart below – you might need to click on it to expand it for this line to become visible). Is this level possible? It is. When gold soared above $2,000, almost nobody thought that it would decline back below its 2011 highs (well, you – my subscribers – did know that). Gold below $1,500 seems unthinkable now, but with rallying long-term rates and soaring USD Index, it could really happen.
The Lion - USD Index (USDX)
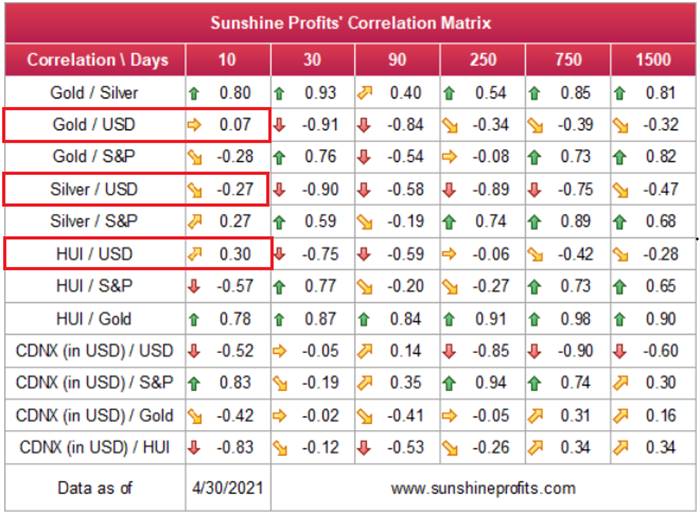
After delivering a ferocious 0.75% rally on Apr. 30 – the greenback’s largest single-day gain since Mar. 4 – the USD Index let out a roar that was heard across all corners of the financial markets. And while gold, silver and mining stocks are still cackling in disobedience – as evidenced by the trios’ decelerating correlations over the last 10 days – every once in a while, the lion has to show the jackals who he is.
To explain, as the USD Index’s recent plight elicits whispers of a new order in the currency kingdom, the greenback’s stoic behavior has been misjudged as weakness. And while the vultures circle and prophecies of the USD Index’s demise become louder, the lion is slowly moving to his feet.
Case in point: with the zeitgeist forecasting new lows for the greenback, non-commercial (speculative) futures traders are still holding firm. Despite the greenback’s suffering, the immaterial decline in net-long positioning last week was relatively muted and highlights investors’ quiet respect for the U.S. dollar.
Please see below:
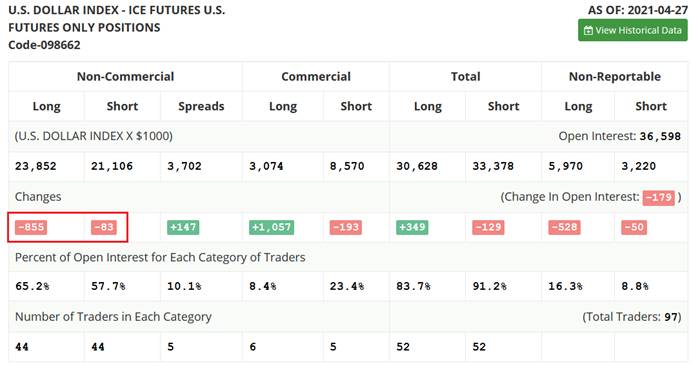
Source: COT
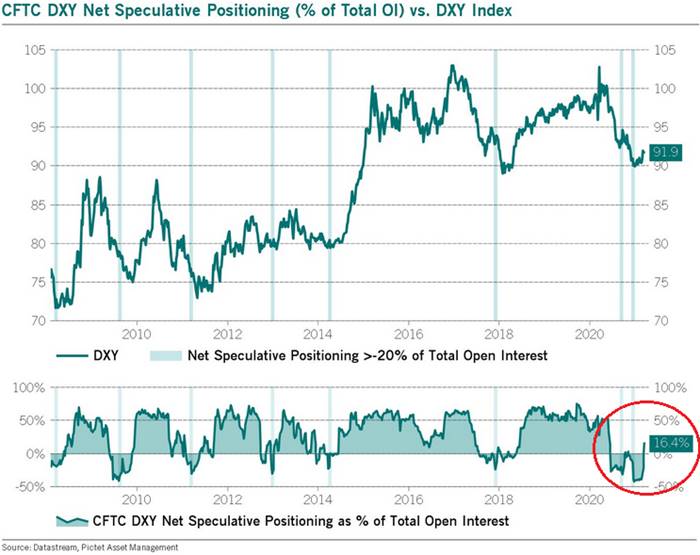
Moreover, with prior periods of extreme pessimism followed by monumental rallies in the USD Index, unless ‘this time is different,’ it’s simply a matter of when, not if, the U.S. dollar feasts on the precious metals’ overconfidence.
To explain, I wrote previously:
When net-speculative short interest as a percentage of total open interest (based on the CoT data) became extremely high in 2014 and 2018, the USD Index recoded two of its sharpest rallies in history. How sharp? Well, let’s take a look at how things developed in the past – after all, history tends to rhyme.
Let’s focus on what happened when the net speculative positions were significantly(!) negative and then they became significantly (!) positive, without paying attention to any tiny moves (like the one that we saw last summer).
In short, rallies that followed periods of extreme pessimism include:
- The big 2008 rally (over 16 index points)
- The big 2009 – 2010 rally (over 14 index points)
- The 2011 – 2012 rally (over 11 index points)
- The 2013 rally (“only” over 5 index points)
- The big 2014 – 2015 rally (over 20 index points)
- The 2018 rally (over 15 index points)
The current rally started at about 89, so if the “normal” (the above shows what is the normal course of action) happens, the USD Index is likely to rally to at least 94, but since the 5-index point rally seems to be the data outlier, it might be better to base the target on the remaining 5 cases. Consequently, one could expect the USD Index to rally by at least 11 – 20 index points, based on the net speculative positions alone. This means the upside target area of about 105 – 114. Consequently, a comeback to the 2020 highs is not only very likely, but also the conservative scenario.
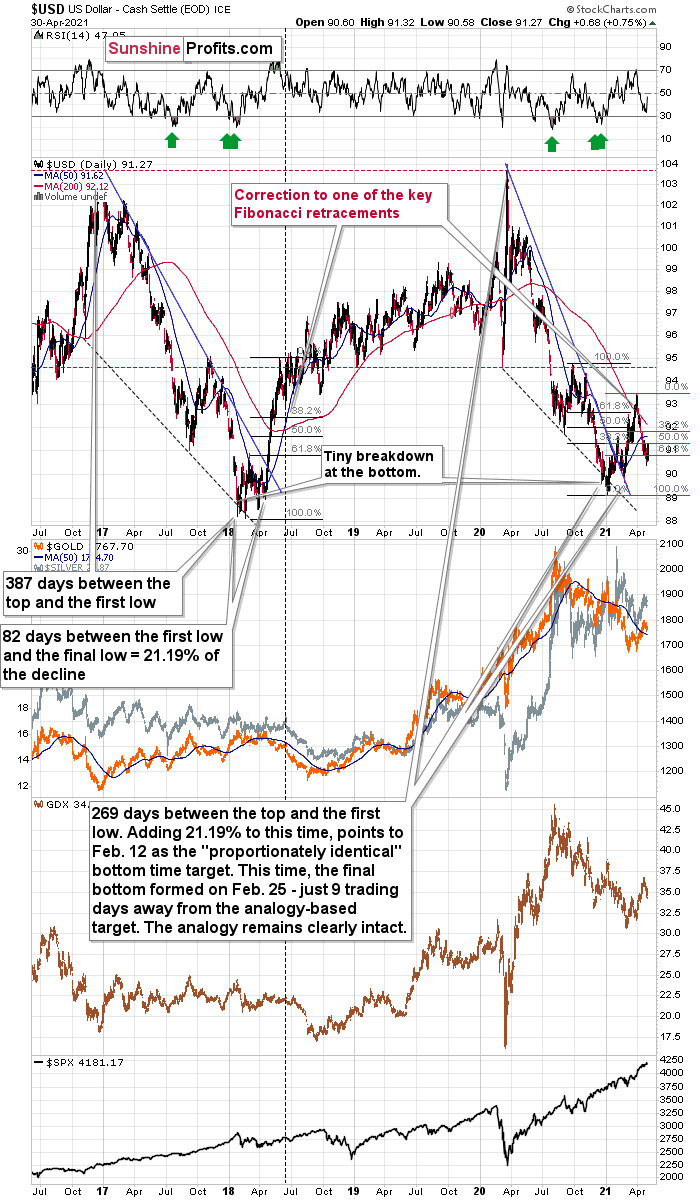
In addition, let’s keep in mind that the very bullish analogy to the 2018 rally remains intact. If you analyze the chart below, you can see that back in 2018, the USD Index rallied sharply and then corrected back to (roughly) the 38.2% Fibonacci retracement level. And while the current decline is of a much larger magnitude than what we saw in mid-April 2018, the USD Index is still following its June 2018 analogue by declining slightly below another critical Fibonacci retracement – the 61.8% one. Moreover, amid the greenback’s surge on Apr. 30 – which I warned was forthcoming – the USD Index invalidated its breakdown below the 61.8% Fibonacci retracement level. The bottom line? The sharp reversal is extremely bullish for the U.S. dollar.
More importantly, though, when the USD Index resumed its uptrend in June 2018 – marked by the vertical dashed line near the middle of the chart – the measured move higher also coincided with an accelerated drawdown of gold , silver and mining stocks.
Please see below:
To explain, I wrote on Apr. 21:
I marked the situation from 2018 that seems similar to what we see right now with a dashed, horizontal line. Back in 2018, the pullback ended when the USD Index moved to its first Fibonacci classic retracement level (the 38.2% one). In case of the current rally, it seems that another classic retracement worked – the 61.8% one.
The very important detail about the June 2018 decline (and bottom) is that while this was the moment after which the USD Index’s started to move higher at a slower pace, it was also the moment after which the precious metals market started to decline faster.
At the beginning of the year, I wrote that the precious metals market was likely to decline and that the preceding rally was likely fake. That’s exactly what happened.
Right now, I’m writing that the recent rally was also fake (a correction within a medium-term decline) and – even more importantly – it seems likely that the next downswing could take place at a higher pace than what we saw so far this year. And – just as was the case in 2018 – this upcoming (fast) decline is likely to lead to the final bottom in the precious metals sector.
As further evidence, I warned on Apr. 30 that the USD Index was ripe for a reversal. And while entering long positions in the USD Index is an appetizing thought, shorting the gold miners offers much more bang for our buck.
I wrote (with regard to possible long positions in the USD Index futures):
I would be looking to re-enter long positions as soon as the USD Index confirms the breakout above the declining resistance line. At the moment of writing these words, the USDX is already trading back above this line, so the only thing that it needs to do now is to stay there. Still, given today’s pre-market movement, it seems that we might even see an invalidation of the move below the 61.8% Fibonacci retracement. A weekly close above both levels would be very bullish for the short term and a sign for me to get back to the long positions .
But – that is all based on the assumption that I would want to have any position in the USDX. And I don’t because I think that having a short position in mining stocks provides a much better risk-to-reward ratio.
That’s exactly what we saw – a weekly close above both levels.
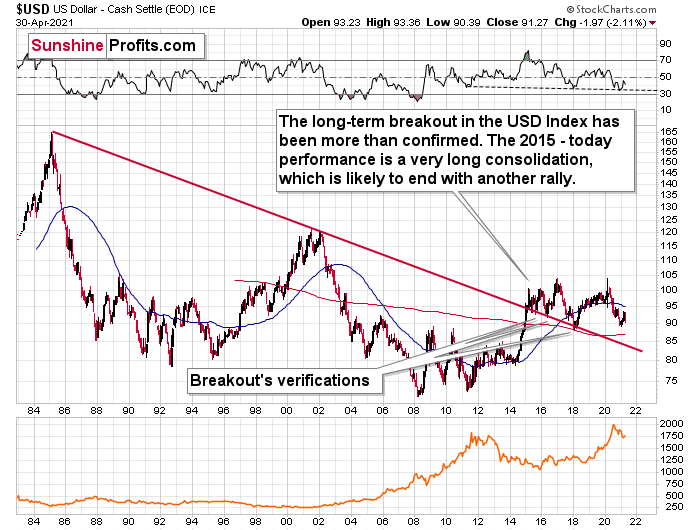
Adding even more ferocity to the USD Index’s roar, the recent downtrend has not invalidated its long-term breakout. And with the long-term implications taking precedence over the medium- and short-term ones, the USDX’s uptrend remains intact.
Please see below:
The bottom line?
Given the magnitude of the 2017-2018 upswing , ~94.5 is likely the USD Index’s first stop. In the months to follow, the USDX will likely exceed 100 at some point over the medium or long term.
Keep in mind though: we’re not bullish on the greenback because of the U.S.’ absolute outperformance. It’s because the region is doing (and likely to do) better than the Eurozone and Japan, and it’s this relative outperformance that matters , not the strength of just one single country or monetary area. After all, the USD Index is a weighted average of currency exchange rates, and the latter move on a relative basis.
In conclusion, with mischievous market participants nipping and clawing at the USD Index’s mane, it’s only a matter of time before the greenback strikes back with a vengeance. And while the precious metals consider the USD Index’s territory up for grabs, the greenback’s pride is unlikely to stay hidden for much longer. As a result, while gold, silver and mining stocks’ gaze across the grassland, the sun has likely set on their recent rallies. However, once the wet season washes away the litany of financial-market imbalances, the eventual bloom will allow the precious metals to grow stronger in the long run.
Thank you for reading our free analysis today. Please note that the above is just a small fraction of today’s all-encompassing Gold & Silver Trading Alert. The latter includes multiple premium details such as the target for gold that could be reached in the next few weeks. If you’d like to read those premium details, we have good news for you. As soon as you sign up for our free gold newsletter, you’ll get a free 7-day no-obligation trial access to our premium Gold & Silver Trading Alerts. It’s really free – sign up today.
Przemyslaw Radomski, CFA
Founder, Editor-in-chief
Tools for Effective Gold & Silver Investments - SunshineProfits.com
Tools für Effektives Gold- und Silber-Investment - SunshineProfits.DE
* * * * *
About Sunshine Profits
Sunshine Profits enables anyone to forecast market changes with a level of accuracy that was once only available to closed-door institutions. It provides free trial access to its best investment tools (including lists of best gold stocks and best silver stocks), proprietary gold & silver indicators, buy & sell signals, weekly newsletter, and more. Seeing is believing.
Disclaimer
All essays, research and information found above represent analyses and opinions of Przemyslaw Radomski, CFA and Sunshine Profits' associates only. As such, it may prove wrong and be a subject to change without notice. Opinions and analyses were based on data available to authors of respective essays at the time of writing. Although the information provided above is based on careful research and sources that are believed to be accurate, Przemyslaw Radomski, CFA and his associates do not guarantee the accuracy or thoroughness of the data or information reported. The opinions published above are neither an offer nor a recommendation to purchase or sell any securities. Mr. Radomski is not a Registered Securities Advisor. By reading Przemyslaw Radomski's, CFA reports you fully agree that he will not be held responsible or liable for any decisions you make regarding any information provided in these reports. Investing, trading and speculation in any financial markets may involve high risk of loss. Przemyslaw Radomski, CFA, Sunshine Profits' employees and affiliates as well as members of their families may have a short or long position in any securities, including those mentioned in any of the reports or essays, and may make additional purchases and/or sales of those securities without notice.
Przemyslaw Radomski Archive |
© 2005-2022 http://www.MarketOracle.co.uk - The Market Oracle is a FREE Daily Financial Markets Analysis & Forecasting online publication.