


Stocks Bear Market Long-term Investing Strategy
Stock-Markets / Stocks Bear Market Oct 20, 2008 - 07:05 PM GMTBy: Nadeem_Walayat

 Financial crashes and panics tend to breed great investment opportunities!
This article seeks to formulate a stocks bear market accumulation investment strategy following the recent market falls that have taken stock prices down far beyond 30% from their highs set a year ago, even the ongoing bounce still leaves the major western stock indices more than 30% off their highs.
In addition to the overall strategy, I will also will discuss the mega-trends that should give an advantage in beating the general indices over the long-run as well as evaluate the key question of the present crisis in that are we heading for another Great Depression or not, which will prove an important factor on the strategy deployed.
Global Banking System Nationalisation is Good News of Sorts
The wholesale nationalisation of the western global banking systems that is well underway following Gordon Browns announcement of the £50 billion bank recapitalisation package just over a week ago is better of the two evils i.e. between a total collapse or for tax payers to fund major equity stakes and hence governments take control of the banks. This effectively puts a floor under the banking crisis and enables the more orderly unwinding of the banks debt bubble built up during the over the counter, off the balance sheet derivatives boom. The expectations are that eventually as the banking system stabilises and banks start to trust one another backed by government loan guarantees, that the governments will gradually reduce their stakes and hence loosen their controls, as the longer the governments keep control of the banking system the worse will be the market reaction as it does not bode well for longer term economic performance.
Therefore the reduction of Government stakes coupled with major regulatory reform of the banking and financial system will increase confidence in the global banking system as clearly the de-regulation and hands off approach towards the 'masters of the universe' was in hindsight a huge mistake. This will take time to occur perhaps we will see the unwinding of government positions and introduction of regulation during the next 6 months , which would be taken as a series of positive and confidence building market events.
However the days of the credit boom are long gone and we perhaps will not seek their like again in our lifetimes. But in the meantime the credit markets remain frozen as the LIBOR interbank money market graph illustrates. The primary goal of governments and central banks is for the spread between interest rates and the base rates to converge which would enable critical lending to start so as commerce and industry can function.The longer the credit freeze goes on the more distress will be felt in the wider economy and hence the recession will be deeper and more prolonged than it could otherwise be. Therefore the key to evaluating the depth of the unfolding recession is when the credit markets more or less unfreeze.
LIBOR Interbank Rate Tsunamis and Quakes
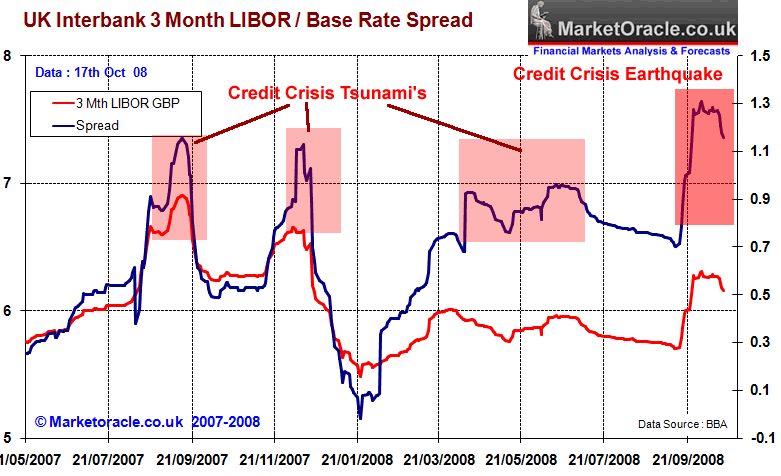
Governments the world over have pumped in an estimated $4 trillion of tax payers money in an attempt to get liquidity flowing amongst the banks. The LIBOR rate after spiking higher on the failure to respond to the panic 0.5% interest rate cuts to prevent a collapse of the financial system. The LIBOR rate following the partial nationalisation of the banking system is now very starting to show some thawing with similar trends exhibited by the US Dollar LIBOR. These trends will be increasingly seen as supportive for the stock markets. However as we have witnessed three Tsunami waves coupled with the credit crisis earthquake all of which led to sharp sell offs in stock prices, and so will the likelyhood of further Tsunami's or credit quakes that would result in sharp drops in stock prices.
Therefore the behaviour of the LIBOR rate that remains an important determinant for the trend of the stock market going forward and therefore should factor into the investment strategy. Given the magnitude and depth of the announced bailouts encompassing capital injections, buying of bad debts, loan guarantees and day to day liquidity, if the LIBOR rate still fails to significantly respond over the coming weeks and months to these initiatives then we may really be on the cusp of another Great Depression, which as the 1930's demonstrated would be extremely nasty for stocks.
The expectations in a rate cutting environment is for the LIBOR rate to be discounting future rate cuts so should be trading below the base interest rates. However that is too much to expect in this credit crisis environment, the best we can hope for is for a steady decline to below 0.70 above the base rate i.e. to 5.20% against a UK base rate of 4.50%.
Deep Interest Rate Cuts
With western interest rates clearly on a downward trend despite high inflation, this is highly supportive of equity prices as usually the expectation during stagflationary periods is for much higher interest rates to curb inflation. However as I have mentioned above the frozen interbank market that fails to respond to interest rate cuts actually acts as a rate hike on the market and hence is bearish and therefore expectations for stock prices again goes back to the what happens to LIBOR, that will take time to rebuild confidence and therefore implies stock prices will continue to be weak whilst the credit freeze remains in force.
It also raises the problem of future interest rate cuts igniting further stock panics if the LIBOR rate failed to fall in response to the interest rate cut and therefore triggering a spike higher in the spread as occurred earlier this month.
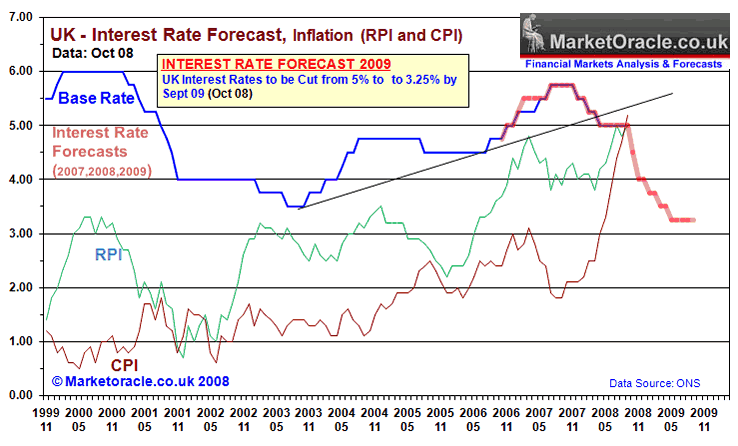
My interest rate forecast for the UK remains for a series of deep cuts from 5% towards the target of 3.25% by September 2009 despite the continuing surge higher in inflation that hit 5.2% for September CPI data. With similar continuing deep cuts in interest rates in the US and Euro-zone.
The Economic Crunch
The western world is heading towards a recession that is clear to all. As I have mentioned above the answer as to how deep the recession will be found in the LIBOR interbank rate which reflects the state of the banking system. Time is critical here as economic contraction is rippling across the world generating further waves of economic contraction, in many ways similar to the way the financial crashette's rippled around the world but over a longer time period. We could see a series of waves of ever greater magnitude of economic contraction or we may see waves of diminishing magnitude, it all depends on the unfreezing of the banking system as well as ensuring that governments do not make the mistakes of the 1930's by putting up barriers to capital flows and international trade.
Whilst finally the governments appear to be getting their act together in terms serious attempts at unfreezing the banking system. However, viewing what's happening on the Baltic shipping exchange that has crashed by more than 50% does not bode well for global economic activity and therefore implies a significant imminent hit to export countries such as China and India. Somehow I doubt that their domestic consumption will be able to fill the gap, with the strong possibility that domestic consumption slows as consumers spend less and save more. This will undoubtedly ripple back to the western markets as capital will be repatriated back to the domestic countries in the light of economic difficulties.
Housing markets in the US and UK are still nowhere near a bottom and thus continue to make consumers feel poorer and both less able and willing to spend. Even those wanting to buy homes are finding that mortgage lenders are demanding far higher deposits than the past and willing to lend much lower earnings multiples therefore leaving prospective home buyers with less money for consumption. Hence the cycle of economic contraction continues implying many more quarters of negative growth.
Therefore my expectation remains that the recession will run for at least another 12 months i.e. into the end of 2009 therefore at this point in time we appear to be looking at a 18 month recession. However stock markets should have built a bottom well before the economy pulls out of recession, perhaps sometime during May to July 2009.
Inflation Will Follow Deflation
The world economy is going through a highly deflationary phase, where some $10 trillion has been wiped off the value of equity markets and another $5 trillion off housing markets over the last 12 months, in addition to the deflationary effect of some $1 trillion in bank losses that has an impact on the economies of several orders of magnitude as the over-leveradged over the counter bets are turning into real losses, perhaps an deflationary impact in the region of $10 trillion. Against which governments via their central banks have pumped in some $4 trillion of liquidity, by ramping up their money supplies, including bank bailout packages in the form of recapitalisation of the banks, clearly we are still in a significant deflationary period, that is resulting in ever increasing amounts of money printing panic measures from countries across the globe to avert a 1930's style deflationary depression, that are sending debt levels soaring.
For instance the official UK debt golden rule until earlier this year was 40% of GDP, this has already been busted through and is probably starting to nudge above 50%, destined to soar to above 60% by late next year as I voiced in April this year. This despite the government deploying off the balance sheet accounting tricks (perhaps learned from the bankrupt banks ?) to hide the real level of debt which is already above 100% of GDP and is expected to hit 200% of GDP by end of 2009, if all of the public sector debt is counted i.e. including the £800 billion unfunded public sector pension liabilities.
Therefore this implies that once the economies find a floor by which time the banking system will have unfrozen, we will experience a great deal of inflation, which ironically tends to be supportive of stock prices in nominal terms, however the cost will be in terms of economic under performance for many more years than would otherwise have transpired. Therefore I don't believe we are headed towards a 1930's style depression but the closest period would be a subdued version of 1970's stagflation, after perhaps another 12 months or so of deflationary pressures that should keep inflation in check until it starts to rise again by early 2010 and hence be accompanied by interest rate rises.
Countries Going Bust
BANG ! Gone is Iceland from high finance back to literally swimming with the fishes. In my analysis of 2nd October 08, I warned that the natural outcome of the credit crisis would be that countries would also start to go bankrupt that would manifest itself along the hyperinflationary bust of the 1920's German Weimar republic. The Prime Minster of Iceland, Geir Haarde, followed a few days later with the statement: "In the perilous situation which exists now on the world's financial markets, providing the banks with a secure life line poses a great risk for the Icelandic nation," Haarde said in a televised address to the nation. "There is a very real danger, fellow citizens, that the Icelandic economy, in the worst case, could be sucked with the banks into the whirlpool and the result could be national bankruptcy." As Icelandic institutions such as Icesave froze their customers accounts.
Iceland is bankrupt, the country's banks have a shortfall or losses of nearly £37 billion which is equivalent to £115,000 per each of the 320,000 citizens, as a comparison total British bank bailout losses to date as a consequences of the nationalisation of Northern Rock, Bradford and Bingley and including the anticipated losses on the £500 billion bank bailout announced (which includes the capital injection of £50 billion) are estimated to be in the region of £110 billion, which amounts to £1,833 of extra debt per every UK citizen.
Therefore there is no way that Iceland can repay or service such a loss which is many times the countries annual GDP of £14 billion. The consequences of which has been witnessed in the foreign exchange markets where the Icelandic Krona has crashed by more than 50% against the US Dollar before it too froze on the forex markets. The only avenue open to Iceland to function economically on a day to day basis i.e. so as to enable Iceland to import resources such as food and fuel is by long-term loans and guarantees from the IMF and other countries such as Russia which has loaned Iceland euros 4 billion. The net effect is that Iceland is likely to experience a severe and prolonged economic recession and will be forced to develop cash generating commercial industries such as fishing to finance the increased debt burden.
Iceland was the first, but it won't be the last, many other countries are teetering on the brink especially amongst the developing world. Therefore close attention needs to be paid as to what happens to Iceland over the next 12 months as in a worse case scenario we could also be in for a similar fate.
Contracting Corporate Earnings Estimates
City and Wall Street analysts continue to reduce corporate earnings estimates for 2009 which has the effect of raising forward price / earnings ratio's and therefore making stocks more expensive despite the sharp fall in stock prices. As analysts became overly optimistic with unrealistic earnings forecasts right up to early 2008, so will analysts become overly pessimistic on the downside, probably even after the market puts in a bottom. One of the biggest triggers for a bottom in the stock market and a buying opportunity for individual stocks will be when stocks rise strongly on disappointing earnings reports. I.e. the expectation is for stocks to fall on bad earnings announcements that fail to beat analyst expectations, however if the stock market rises instead then that would be taken as a bullish trigger for that particular stock and the market as a whole. Already earnings estimates for the market as a whole are hitting 60% of where they were barely 6 months ago, therefore further deteriorating earnings forecast towards say 30% off the peak estimates may prove bullish for the stock market as it sets the scene for overly pessimistic earnings forecasts to result in surprises to the upside, again what we will need to watch for is the reaction of stock prices, as stocks that fail to rally on beating earnings expectations would not bode well for that particular companies longer-term prospects.
The Credit Crisis, Gold, Chaos and Uncertainty
US Dollar is soaring and commodities including Gold are collapsing - The credit crisis is resulting several contradictory trends whilst analysis can lend favourably towards certain trends, however as with the earths climate going through the process of flipping over into a new system or equilibrium, so is the worlds financial system which is exhibiting phenomena that can leave many a experienced analyst puzzled. The trend for the US Dollar was clear enough to support the earlier analysis of 17th August 2008, which concluded with a Dollar trend higher outlook towards USD 90 from the low of 71 earlier this year. Action to date supports this analysis, however at the same time the near collapse of the financial system and panic amongst governments announcing ever larger bailouts strongly suggested that gold's correction from the March highs was coming to an end and that gold should benefit from the escalating panic, which made me reverse my bearish stance as March and turn bullish in the analysis of 23rd Sept, where the conclusion of the analysis was for gold to have a volatile trend higher towards $1200 by March 2009. However the price action after following the trend into early October appears to be breaking down much as the worlds financial system itself is breaking down towards a new equilibrium.
I am usually quite skeptical of the conspiracy theories surrounding market manipulation. But the reaction of gold to the wholesale global money printing binge to save the banking systems is how can I put it, chaotic. Whilst undoubtedly to many suggestions of a gold price manipulation may come across as nonsense, however there is a strong case for gold price manipulation by the worlds largest derivatives player JP Morgan, Rob Kirby in a recent article made quite a strong and detailed case for such manipulation due to the huge gold short position that JP Morgan holds, for more on this topic see - Gold Price Manipulation- Bear Stearns Murdered at the Golden Gates
Clearly trading strategies based on forecasting the markets tend to break down during more chaotic times. However as I elaborate in my next newsletter scheduled The Real Secrets of Successful Trading, I will seek to explain the methodology that always has me on their right side of every crash and which is immune to chaotic instability. If you want to know more about the real secrets of trading then make sure your registered to receive my next scheduled and always free newsletter.
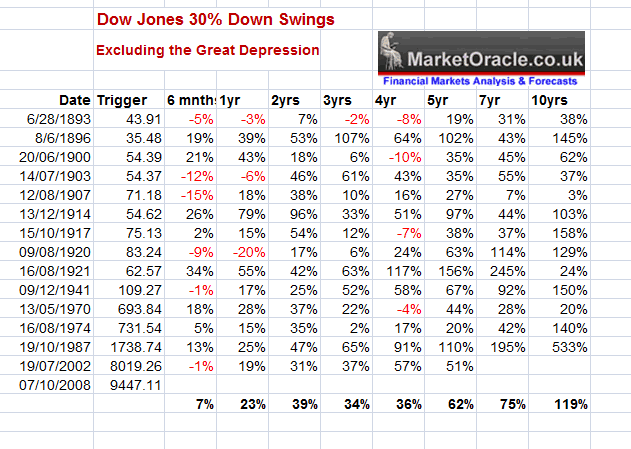
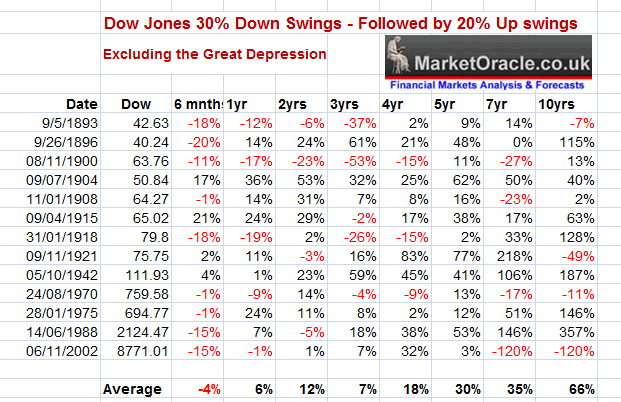
Analysis of Bear Markets and the Great Depression
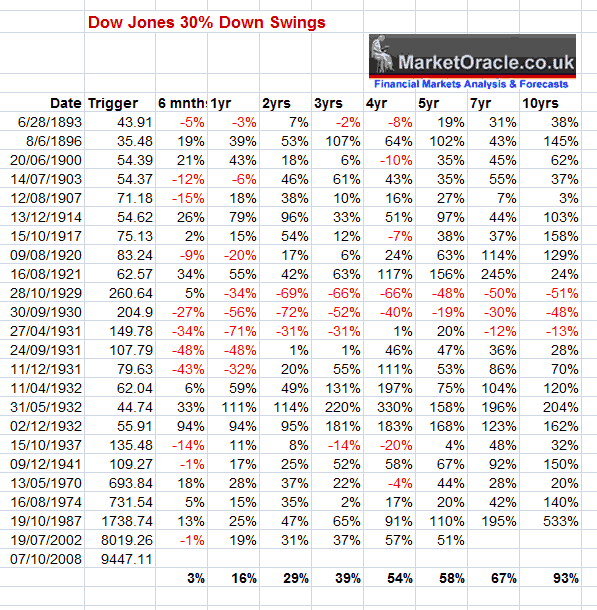
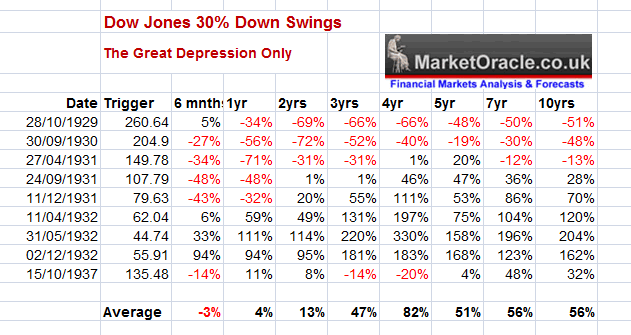
The above three tables suggest the following conclusions of Dow Jones Down swings of more than 30% as we have recently experienced.
A. Excluding the Great Depression -The stock market tends to rally by an average of 40% during the next two years following the 30% drop, and an average of 120% over 10 years. (excluding impact of dividends).
B. The Great Depression - Investing during the first or second years of the Great Depression would NOT have seen gain in 10 years. However investing during the third year of the Great Depression bear market would have seen extremely high stock market gains of over 100% in 2 years.
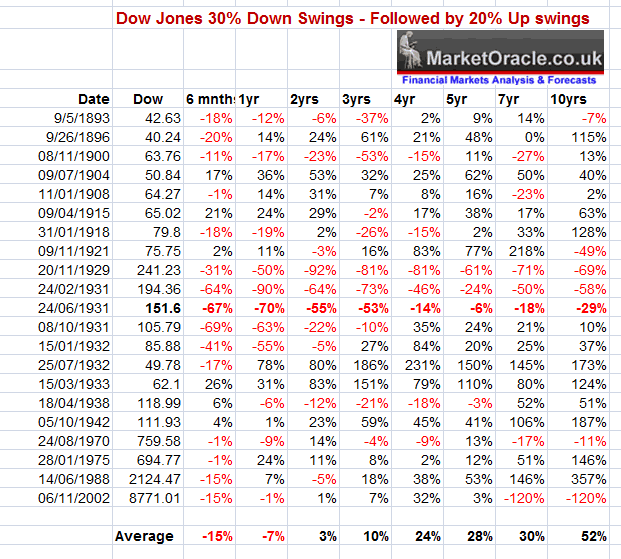
The above tables analyses the impact of 30% down swings that were followed by upswings of 20% or more I.e. if stocks rallied by more than 20% following the 30% drops. This is expected to have the effect of reducing the impact of counter-trend rallies within a bear market.
A. Excluding the Great Depression - The table shows no advantage in waiting for a 20% buy trigger before entering the stock market after it has already fallen by 30%.
B. The Great Depression - Similarly waiting for a 20% bounce during the Great Depression would have resulted in worse results.
Conclusion - Therefore the key here is to whether or not to discount another Great Depression from occurring over the next 1 to 2 years, in which case analysis suggests buying during the third year of the bear market. However, barring a great depression the analysis suggests the best time to buy is actually when the stock market has fallen by more than 30% therefore suggesting a strategy of buying on the dips for the long-run, which outperforms buying a 20% gain by as much as 60% over 10 years. This is contrary to Wallstreet folklore which suggests you should Buy the rallies.
Current State of the Bear Market and Trend Conclusion
The sum of the previous analysis suggests that we can discount a 1930's style wipeout of the stock market, and viewing a volatile sideways trend for at least the next 6 months to be followed by an gradual upward curve. In the meantime the credit chaos events will undoubtedly see much volatility that will see several spikes higher and lower in the 10% region, with a high probability that we will see the recent lows breached at least once between now and June 2009 as the most probable outcome is something that is reminiscent of the 1970's which suggests that the stock markets are headed towards the 2003 lows. Which given the recent sell off implies a further decline from recent lows in the order of 10%.
We have witnessed a selling climax of sorts at extremely high volatility which is usually associated with significant market bottoms. Therefore suggests a sizeable rally that is likely to see stocks recover at least 20% from the lows into November and probably further.
Bear Market Accumulation Investment Strategy
Clearly we have several investment triggers to work with including analysis of the previous bear markets, the LIBOR unfreezing trigger, and then we have technical analysis as per chart patterns.
An investment strategy needs to take these factors into account to determine when the anticipated capital is to be invested.
- Bear Markets Analysis - Favors buying on selloff's during the post 30% drop bear phase.
- LIBOR is frozen so is a negative for investing at this time. The aim is to see LIBOR to fall to below 0.7% above base the interest rate. Current is 1.16%, the more it falls the more bullish the outlook for the stock markets.
- Chart price patterns remain negative, they clearly indicate that the stock market is not done on the downside.
Therefore the rules for stock market investing are -
1. Allocate the amount of capital that is to be invested over a period of time as 100%.
2. The aim is to invest between 5% and 15% per month of the above capital.
3. The trigger for 10% investment in any month is if the stock indices one is investing are within 10% from the bear markets low.
4. The Trigger for an additional 5% investment is if in any month LIBOR is below 0.7% above the base interest rate.
The goal is to scale into the stock market over the next 6 to 12 months i.e. effectively buying into weakness rather than strength and limiting investing when the market exhibits a sharp rally. This implies an investment range of between 5% and 15% in any given month.
I.e. if the intention is to invest $10,000 into the stock market then one would aim to invest between $500 to $1,500 in any month that fullfilled the investment criteria.
Therefore depending on how the stock market performs over the next 12 months, the amount invested in a stocks portfolio should gradually increase towards the 100% commitment.
I will be keeping readers of this newsletter updated on the effectiveness of this strategy on a regular basis towards the end of each month as to the performance to date which will use the Dow Jones Index, and Sterling LIBOR to determine signals as elaborated above.
The same or similar rules could apply to other western stock markets.
The Mega-trends - Where to Invest
The Mega-trends of Global Warming, Peak Oil, Rise of Asian Middle class and Population growth determine the sectors to focus on that are expected to outperform the general indices over the long-run.
Global Warming - Despite government actions and much noise about cutting back on co2, I believe we have long since passed the tipping point when we could have made any difference to the climate which will therefore continue to change that implies that most of the world will get much hotter and far more quickly then any of us can imagine.
This mega-trend implies greater demand for food consumption whilst at the same time supply being hit by irreversible climate change. Just as 1930's over farming turned Americas mid-west bread basket into a dust bowl, so does climate change of rising temperatures and falling rainfall likely to result in a modern day dust bowls, just as global agricultural consumption is soaring. Therefore the agricultural sector remains a long-term investing mega-trend. For more on tipping points and chaos theory make sure to subscribe to my weekly newsletter as the next scheduled newsletter will cover the real secrets of successful trading.
Crude Oil
Peak oil ensures that in the long-run crude oil prices are headed much higher, well beyond the peak of $147 that we saw less than 4 months ago. The speculative boom that took crude oil from $80 to $147 was correctly analysed in the articles of 4th July Crude Oil Seeking Black Swan for Spike above $150 in Overbought State and 16tth July- Crude Oil Parabolic Move Driven by Inflation Hedging that Could Unwind , that concluded that the rise in the oil price was as a consequence of inflation hedging that would unwind over the next 3 to 6months towards a target of $80, which is what has subsequently transpired with crude oil having recently fallen below $80.
The parabolic rise on the oil price was never reflected in the oil majors stock prices which was a strong indicator that the rise was not supported by fundamentals and would prove temporary. Similarly the crash in oil prices has not been played out with declines in the stock prices of oil majors, that although have fallen but nowhere near to the same degree.
Therefore the oil and energy is the second sector for long-term investments in addition to agriculture especially given the recent falls as a consequence of global deleveraging. Yes crude oil is in a volatile phase that could trend continue trending lower to as low as $60, as markets tend to overextend to the downside as well as to the upside, but the speculative bubble has been more or less extinguished from crude oil for which the natural price at this point in time in advance of a recession is $80 NOT $200 as many analysts were suggesting right at the very peak.
Water Crunch
The United States is into its 9th year of drought whilst demand for water is ever increasing, therefore the US looks set to be heading towards a water crunch in the near future with a similar crisis to that which was witnessed as a consequence of the credit crisis that could contribute towards's turning a recession into a Great Depression. Therefore in addition to the water sector, this would also support the point of view that agriculture is a mega-trend sector even more so than energy, for economic contraction will result in falling demand for energy whilst population growth will continue to demand ever increasing food production.
Hedging Your Portfolio by Using Put Options
The utilisation of PUT options is to hedge against a bear market by buying distant deep out of the money options on the primary indices in which you are invested can help to offset losses during market crashes. Note the primary aim of hedging is NOT to speculative but to pay a premium to ensure against a large fall in portfolio values, therefore you do not set out to make a profit on the hedge as the general outcome will result in less return than the loss on the portfolio. The premium for put option insurance should be covered by the dividends earned by from the stock holdings, off course as long as individual stocks and funds don't cancel dividends or even go bankrupt! as we have witnessed in the banking sector.
However recent extreme volatility as indicated by the VIX which has exploded not only above 30, which was previously considered high but actually went past 80 this week is reflective of how expensive option prices are at this point in time, which means that PUT options purchased during earlier counter-trend rallies to have risen far more significantly that one could have expected, this extreme volatility IS TEMPORARY and the expectation is for volatility to subside just as rapidly as it has risen which suggests that stock markets will tend to be much calmer in the coming weeks than we have witnessed.
Hedging Against Stock Purchases
Call Options can similarly be used instead of buying the underlying stocks where one is hedging against a rise in the stock market over the next 6 to 9 months whilst insuring against a deep bear market that would have eroded the value of actual stock purchases. However as I have mentioned above the volatility has resulted in over inflated prices, therefore new hedge positions would need to be delayed until volatility decreases which would result in a fall in option premiums. The goal here is for the interest earned on funds on deposit that are destined to be invested in the stock market to pay for the call options.
Again I reiterate the difference between using options for hedging instead of speculating i.e. the aim is to pay a premium to hedge your portfolio against a fall in the stock market or the hedging of cash that you would have invested against a rise in the stock market or depending on market behaviour a mixture of both. The premiums should be covered by dividends on the stocks for puts, or interest earned on the cash for calls.
With regards trading the markets, I utilise stock index futures, in which regard look forward to my next always FREE newsletter that will cover the Real Secrets of Successful Trading. It may prove a real eye opener to many ! I had originally planned to complete the article on the 21st anniversary of the Great crash of 1987, however market volatility has consumed much of my time hence the subsquent delay. Subscribe to my free Newsletter Now to ensure you reserve the benefit of over 20 years experience of trading.
Your analyst eager to scale into crashing markets despite the economic crunch.
By Nadeem Walayat
http://www.marketoracle.co.uk
Copyright © 2005-08 Marketoracle.co.uk (Market Oracle Ltd). All rights reserved.
Nadeem Walayat has over 20 years experience of trading derivatives, portfolio management and analysing the financial markets, including one of few who both anticipated and Beat the 1987 Crash. Nadeem is the Editor of The Market Oracle, a FREE Daily Financial Markets Analysis & Forecasting online publication. We present in-depth analysis from over 150 experienced analysts on a range of views of the probable direction of the financial markets. Thus enabling our readers to arrive at an informed opinion on future market direction. http://www.marketoracle.co.uk
Disclaimer: The above is a matter of opinion provided for general information purposes only and is not intended as investment advice. Information and analysis above are derived from sources and utilising methods believed to be reliable, but we cannot accept responsibility for any trading losses you may incur as a result of this analysis. Individuals should consult with their personal financial advisors before engaging in any trading activities.
Attention Editors and Publishers! - You have permission to republish THIS article. Republished articles must include attribution to the author and links back to the http://www.marketoracle.co.uk . Please send an email to republish@marketoracle.co.uk, to include a link to the published article.
Nadeem Walayat Archive |
© 2005-2022 http://www.MarketOracle.co.uk - The Market Oracle is a FREE Daily Financial Markets Analysis & Forecasting online publication.