Emerging Markets Turnaround is Getting Closer—Here’s Why
Stock-Markets / Emerging Markets Nov 03, 2008 - 06:26 PM GMTBy: Frank_Holmes
 These are the kind of markets that test the courage of investors.
Currency volatility overlaying equity volatility has exaggerated all price actions. We believe the trillions of dollars of liquidity slowly filtering through the financial system will produce sunshine for these markets.
But as we've said in our recent presentation, “ Enduring a Global Financial Crisis ,” we believe this will not be a V-shaped bottom but instead a U-shared bottom. A U-shaped bottom is a stockpicker's dream.
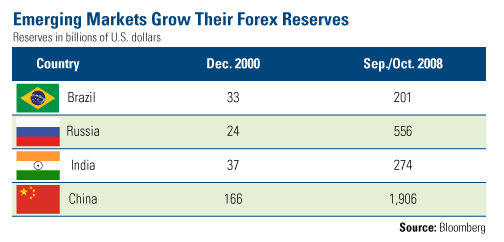
One place to find these stocks is in emerging markets. The dramatic growth in foreign exchange reserves of the BRIC nations makes them attractive.
As you can see in the chart below, the $260 billion in combined reserves in those four countries in late 2000 is less than India's reserves now and is but a small fraction of the nearly $2 trillion held by China. Most of those reserves are held in dollars.

These dollar reserves, and the hundreds of billions more held in the Middle East and other emerging markets, provide a valuable buffer in uncertain economic times. These reserves were far smaller a decade ago, when both Russia and Asia went through currency crises.
And with the dollar's recent rally, these reserves are worth more than they were just a couple of months ago. The size of reserves and their enhanced value could reinvigorate these key emerging markets and accelerate their economic recovery.
I am often asked why the dollar and yen have been so strong lately while other currencies and commodities have been clobbered. The Reuters/Jeffries CRB Commodities Index, for example, lost 24 percent of its value in October -- its worst month ever.
Many banks and hedge funds have borrowed in dollars and yen and used that money to invest in euros, emerging markets, commodities and equities. Now they are being forced to pay back these loans, so they have had to sell commodities, stocks, emerging markets and euros to get dollars and yen. This has created a buying frenzy in dollars and yen, and in turn exaggerated market volatility.
Many of these emerging markets companies are trading at two to six times earnings, compared to the S&P 500 average at more than 21 times earnings. This disparity can't last forever, and as liquidity is pumped into the system, the indiscriminant selling will stop and global stock prices will firm up and begin their return to historic P/E ratios.

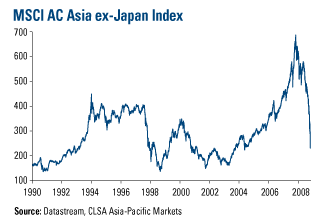
Looking at Asia , the MSCI AC Asia ex-Japan Index has fallen off abruptly in recent months, with many stock markets trading at price-to-book ratios near their lows during the 1998 Asian meltdown.
Risks remain in emerging markets, but with valuations so low in a region whose economies are so much larger and more diversified and resilient than they were a decade ago, the opportunities look increasingly attractive.
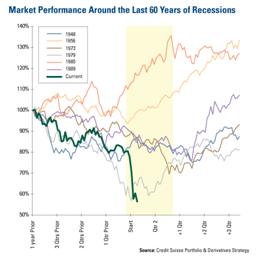
At home, new research from Credit Suisse points out that the 40 percent market decline this year is the largest market sell-off in the past 60 years. The average is around 15 percent.
The key questions are, of course, how much farther down will we go and when will a sustainable recovery begin? Both of these questions are hard to answer under normal conditions, and what we've been witnessing has hardly been normal. Just look at the chart below that shows market performance during recessions going back to 1948.

Credit Suisse points out that record amounts of institutional cash are waiting for a clearer sign of a bottom. Typically when these investors start believing in markets again, they deploy their cash and give the recovery rally a nice push.
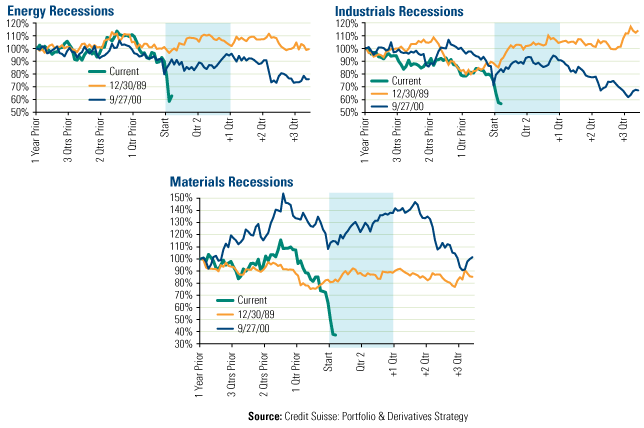
The three charts below compare the recent performance of three of our key sectors—energy, materials and industrials—to the performance heading into the recessions of 1989 and 2000.
The near-vertical drop at the start of the three quarter of 2008 put all three sectors well below the bottom seen in the 1989 and 2000 recessions. If history is any guide, these sectors have good upside potential as we work our way through and eventually emerge from the current recessionary conditions.

By Frank Holmes, CEO , U.S. Global Investors
Frank Holmes is CEO and chief investment officer at U.S. Global Investors , a Texas-based investment adviser that specializes in natural resources, emerging markets and global infrastructure. The company's 13 mutual funds include the Global Resources Fund (PSPFX) , Gold and Precious Metals Fund (USERX) and Global MegaTrends Fund (MEGAX) .
More timely commentary from Frank Holmes is available in his investment blog, “Frank Talk”: www.usfunds.com/franktalk .
Please consider carefully the fund's investment objectives, risks, charges and expenses. For this and other important information, obtain a fund prospectus by visiting www.usfunds.com or by calling 1-800-US-FUNDS (1-800-873-8637). Read it carefully before investing. Distributed by U.S. Global Brokerage, Inc.
All opinions expressed and data provided are subject to change without notice. Some of these opinions may not be appropriate to every investor. Gold funds may be susceptible to adverse economic, political or regulatory developments due to concentrating in a single theme. The price of gold is subject to substantial price fluctuations over short periods of time and may be affected by unpredicted international monetary and political policies. We suggest investing no more than 5% to 10% of your portfolio in gold or gold stocks. The following securities mentioned in the article were held by one or more of U.S. Global Investors family of funds as of 12-31-07 : streetTRACKS Gold Trust.
Frank Holmes Archive |
© 2005-2022 http://www.MarketOracle.co.uk - The Market Oracle is a FREE Daily Financial Markets Analysis & Forecasting online publication.


