


Stocks Bear Market Next Downleg About to Begin?
Stock-Markets / Stocks Bear Market Nov 18, 2008 - 10:37 AM GMTBy: Marty_Chenard

 Is the stock market close to deciding whether to give us another leg down?
Today' chart looks at "the change of balance fight" between how many stocks are shifting between being Very Strong in Strength, or Very Weak in Strength.
Today's Question: Can this "change of balance fight" chart analysis signal new down turns in the stock market?
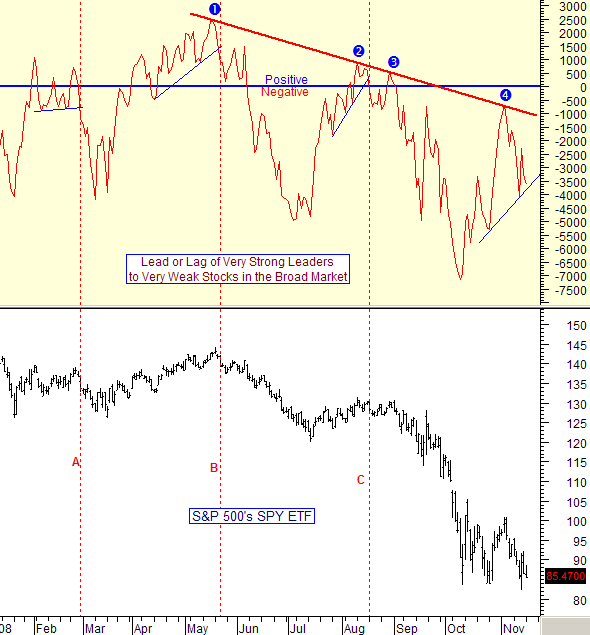
For the answer, let's go to today's Lead/Lag Indicator chart of the "Very Strong stocks minus the number of Very Weak Stocks".
The chart below goes back to the beginning of 2008. For a down turn signal, a support trend line must be broken like the instances at the end of February, mid May, and mid August ... see the vertical red dotted lines
(A, B, and C) for when this occurred. As you can see below, in all 3 cases, the market retreated afterwards.
Note also, that this Lead/Lag Indicator shows a series of lower/highs that continued to generate lower/ lows with more damage occurring in the stock market. Also note how the lower/ highs all failed at points 1, 2, 3, and 4 when they reached the red resistance line.
Notice that after the peak failure move at label 4, the Lead/Lag Indicator dropped like all the previous occasions. But, also notice that the Lead/lag Indicator has continued making higher/lows and higher/highs since bottoming out ... so it has been trending up.
Do we now get another drop with a lower/low that takes the market down another leg?
The answer will come soon because the indicator ended yesterday being very close to retesting the support line. If the support gets tested and breaks to the downside in the next few days, then that would be a condition favoring more downside action. (The Lead/Lag Indicator is posted on the paid website every day and will be reposted here in early December.)
____________________________________________________________________
*** Feel free to share this page with others by using the "Send this Page to a Friend" link below.
By Marty Chenard
http://www.stocktiming.com/
Please Note: We do not issue Buy or Sell timing recommendations on these Free daily update pages . I hope you understand, that in fairness, our Buy/Sell recommendations and advanced market Models are only available to our paid subscribers on a password required basis. Membership information
Marty Chenard is the Author and Teacher of two Seminar Courses on "Advanced Technical Analysis Investing", Mr. Chenard has been investing for over 30 years. In 2001 when the NASDAQ dropped 24.5%, his personal investment performance for the year was a gain of 57.428%. He is an Advanced Stock Market Technical Analyst that has developed his own proprietary analytical tools. As a result, he was out of the market two weeks before the 1987 Crash in the most recent Bear Market he faxed his Members in March 2000 telling them all to SELL. He is an advanced technical analyst and not an investment advisor, nor a securities broker.
Marty Chenard Archive |
© 2005-2022 http://www.MarketOracle.co.uk - The Market Oracle is a FREE Daily Financial Markets Analysis & Forecasting online publication.