Stock Markets Heading for Successful Retest of November Lows
Stock-Markets / Stocks Bear Market Feb 15, 2009 - 07:14 AM GMTBy: Mike_Burk
 The good news is: Everything is in place for a successful retest of the November lows.
Short Term I found no indicators that made a compelling case for a short term movement in either direction.
Intermediate term
In study I did about 20 years ago, I found that when the market made a low with a lot of new lows there was always a retest of the low. The study was done using the Dow Jones Industrial Average (DJIA) and NYSE new high and new low data. New highs and new lows have been calculated on a 52 week trailing basis since January 1, 1978 so the study was done with 11 - 12 years of data. "A lot of new lows" is an ambiguous and moving target. What I found was when the number was less than 400 the bottom was "V" shaped and when the number exceeded 400 there was a retest following a rally making a W shaped bottom. 1990 was the single example of multiple retests. In 1990 there were 711 new lows at the August 23 low, 444 new lows at the September 24 retest and 375 at the October 11 bottom. In 1978 there were about 1500 issues traded on the NYSE and that number was virtually unchanged in 1990. Currently there are about 3000 issues traded on the NYSE, most of the increase has been in fixed income issues.
My expectations for market lows have been and are currently formed by this study. In the past 30 years there has been one significant failure, 1999. In 1999 most of the major indices moved higher from large increases in a few large cap tech issues while the broader market languished. On December 14, 1999 there were 565 new lows and there was nothing in the major averages suggesting a problem.
A common complaint about the current market is there is no leadership so distortions like 1999 are not an issue.
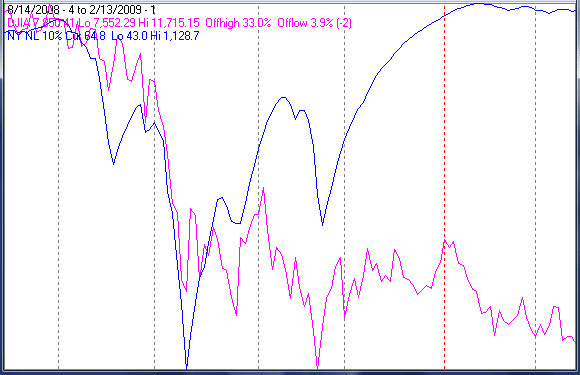
Last October 10 there were 2901 new lows on the NYSE, a record by any measure. On the November 20 retest there were 1894 new lows (a lot by any measure). The largest number of new lows we have seen since December 5 is 132 on February 2. As of Friday's close the DJIA is 3.9% above its November 20 low. If the DJIA retests its November low without a large build up of new lows that should mark an intermediate term low.
The chart below covers the past 6 months showing the DJIA in magenta and a 10% trend of NYSE new lows (NY NL) in blue. Dashed vertical lines have been drawn on the 1st trading day of each month. NY NL has been plotted on an inverted Y axis so decreasing new lows move the indicator upward (up is good).

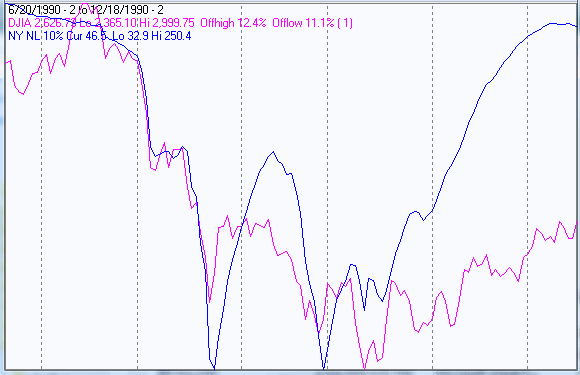
The next chart shows the same index and indicator at the 1990 low to give you a perspective on how the indicator worked then.

It would take a large build up of new lows to make the current chart look as bad as the 1990 chart at a retest.
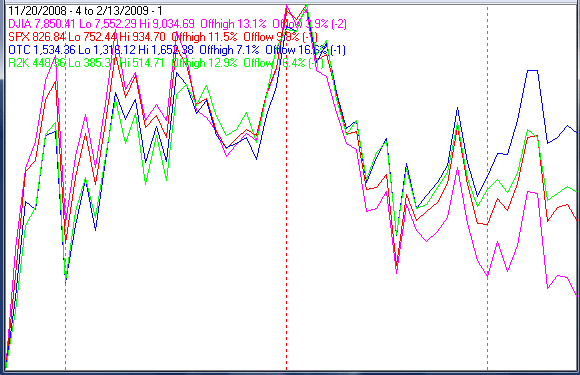
I often declare the secondaries lead both up and down and since the November low, they have been outperforming the blue chips.
The chart below covers the period from the November low through last Friday's close. The DJIA is shown in magenta, the S&P 500 (SPX in red), the NASDAQ composite (OTC) in blue and the Russell 2000 (R2K) in green. The indices are plotted on semi log scales to show their relative performance.
The tech heavy OTC has been leading followed by the small cap R2K, SPX and the DJIA as the weakest.

Seasonality
Next week is the week prior to the 3rd Friday of February during the 1st year of the Presidential Cycle.
The tables show the daily return on a percentage basis for the week prior to the 3rd Friday of February during the 1st year of the Presidential Cycle. OTC data covers the period from 1963 - 2008 and SPX data from 1953 - 2008. Prior to 1953 the market traded 6 days a week so that data has been ignored. There are summaries for both the 1st year of the Presidential Cycle and all years combined.
Returns over all years have been slightly positive; returns during the 1st year of the Presidential Cycle have been negative.
Report for the week before the 3rd Friday of February.
The number following the year is the position in the presidential cycle.
Daily returns from Monday through 3rd Friday.
| OTC Presidential Year 1 | ||||||
| Year | Mon | Tue | Wed | Thur | Fri | Totals |
| 1965-1 | 0.43% | -0.25% | -0.40% | 0.79% | 0.21% | 0.77% |
| 1969-1 | -1.88% | -0.74% | -0.90% | 0.53% | -0.82% | -3.82% |
| 1973-1 | 1.52% | 1.06% | -1.39% | -0.79% | 0.10% | 0.50% |
| 1977-1 | 0.04% | 0.29% | 0.22% | -0.06% | -0.19% | 0.30% |
| 1981-1 | 0.00% | 0.05% | 0.39% | -1.02% | -0.23% | -0.82% |
| 1985-1 | -0.32% | -0.30% | 0.61% | 0.01% | -0.22% | -0.22% |
| Avg | -0.16% | 0.07% | -0.22% | -0.27% | -0.27% | -0.81% |
| 1989-1 | -0.27% | 0.19% | 0.67% | 0.24% | 0.37% | 1.19% |
| 1993-1 | 0.00% | -3.64% | -0.90% | 0.46% | 0.18% | -3.90% |
| 1997-1 | 0.00% | 0.00% | -0.12% | -1.33% | -0.97% | -2.42% |
| 2001-1 | 0.76% | -2.49% | 2.62% | 2.47% | -4.99% | -1.64% |
| 2005-1 | 0.30% | 0.30% | -0.09% | -1.25% | -0.13% | -0.86% |
| Avg | 0.26% | -1.41% | 0.44% | 0.12% | -1.11% | -1.53% |
| OTC summary for Presidential Year 1 1965 - 2005 | ||||||
| Avg | 0.07% | -0.55% | 0.06% | 0.00% | -0.61% | -0.99% |
| Win% | 63% | 50% | 45% | 55% | 36% | 36% |
| OTC summary for all years 1963 - 2008 | ||||||
| Avg | 0.05% | -0.09% | 0.06% | 0.17% | -0.17% | 0.00% |
| Win% | 57% | 47% | 57% | 61% | 48% | 57% |
| SPX Presidential Year 1 | ||||||
| Year | Mon | Tue | Wed | Thur | Fri | Totals |
| 1953-1 | -0.35% | -0.58% | -0.08% | 0.35% | 0.23% | -0.43% |
| 1957-1 | -1.73% | -0.42% | 1.53% | -0.12% | 1.21% | 0.47% |
| 1961-1 | -0.59% | 0.44% | 0.83% | 0.61% | -0.32% | 0.98% |
| 1965-1 | -0.12% | -0.46% | 0.12% | 0.33% | 0.19% | 0.05% |
| 1969-1 | -1.19% | -0.63% | 0.48% | -0.31% | -0.01% | -1.67% |
| 1973-1 | 1.20% | 0.62% | -1.44% | -0.56% | 0.46% | 0.28% |
| 1977-1 | 0.52% | 0.30% | 0.46% | -0.57% | -0.43% | 0.27% |
| 1981-1 | 0.00% | 0.65% | 0.52% | -1.46% | -0.02% | -0.30% |
| 1985-1 | -0.92% | 0.03% | 1.55% | -0.51% | -0.44% | -0.31% |
| Avg | -0.10% | 0.19% | 0.31% | -0.68% | -0.09% | -0.34% |
| 1989-1 | 0.18% | -0.25% | 0.83% | 0.19% | 0.66% | 1.62% |
| 1993-1 | 0.00% | -2.40% | -0.14% | -0.32% | 0.54% | -2.33% |
| 1997-1 | 0.00% | 0.97% | -0.47% | -1.19% | -0.13% | -0.82% |
| 2001-1 | 1.18% | -0.87% | -0.22% | 0.81% | -1.89% | -0.98% |
| 2005-1 | 0.07% | 0.33% | 0.02% | -0.79% | 0.07% | -0.30% |
| Avg | 0.48% | -0.44% | 0.00% | -0.26% | -0.15% | -0.56% |
| SPX summary for Presidential Year 1 1953 - 2005 | ||||||
| Avg | -0.16% | -0.16% | 0.29% | -0.25% | 0.01% | -0.25% |
| Win% | 45% | 50% | 64% | 36% | 50% | 43% |
| SPX summary for all years 1953 - 2008 | ||||||
| Avg | 0.05% | 0.00% | 0.19% | -0.05% | 0.02% | 0.19% |
| Win% | 45% | 55% | 59% | 46% | 46% | 57% |
Money supply (M2)
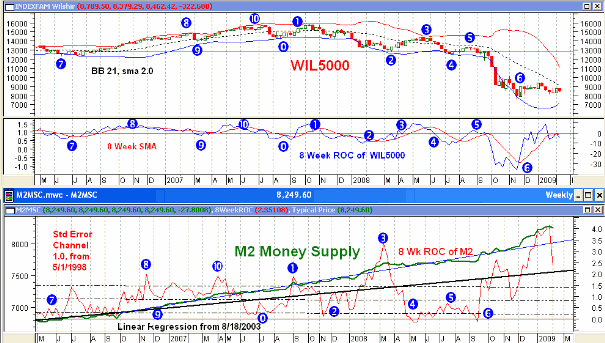
The money supply chart was provided by Gordon Harms. Last week M2 leveled off from its explosive growth of the past 2 months.

Conclusion
So far the market has been following the February seasonal average for the 1st year of the Presidential Cycle very closely and seasonally next week has been weak.
I expect the major indices to be lower on Friday February 20 than they were on Friday February 13.
Thank you,
By Mike Burk
To subscribe to this report : http://alphaim.net/signup.html
Gordon Harms produces a Power Point for our local timing group. You can get a copy of that at: http://www.stockmarket-ta.com/ .
Disclaimer: Mike Burk is an employee and principal of Alpha Investment Management (Alpha) a registered investment advisor. Charts and figures presented herein are believed to be reliable but we cannot attest to their accuracy. Recent (last 10-15 yrs.) data has been supplied by CSI (csidata.com), FastTrack (fasttrack.net), Quotes Plus (qp2.com) and the Wall Street Journal (wsj.com). Historical data is from Barron's and ISI price books. The views expressed are provided for information purposes only and should not be construed in any way as investment advice. Furthermore, the opinions expressed may change without notice.
Mike Burk Archive |
© 2005-2022 http://www.MarketOracle.co.uk - The Market Oracle is a FREE Daily Financial Markets Analysis & Forecasting online publication.


