Gordon Brown Bankrupting Britain as Tax Payer Liabilities Soar- Update
Politics / UK Economy Feb 24, 2009 - 01:53 PM GMTBy: Nadeem_Walayat

 This analysis presents the current status of Britain's path towards bankruptcy which I first pointed out in April 2008 which followed the Bank of England's initial offering of a £50 billion slush fund to the banks that would never be repaid and marked the tip of the bank bailout ice-berg.
NEW Tax Payer Liabilities
- £400 billion for the purchase of Toxic Assets
- £100 billion for the Bank of England to print money.
- £10 billion for the Northern Rock Black hole
This is on top of the £700 billion already committed which takes the total now to approximately £1,200 trillion, set this again official Public sector net debt of about £700 billion then this gives one a scale of the magnitude of the exploding tax payer liabilities that risk the bankruptcy of Britain which would play itself out in the form of government debt default and a currency crash, as warned of in Novembers analysis - Bankrupt Britain Trending Towards Hyper-Inflation?
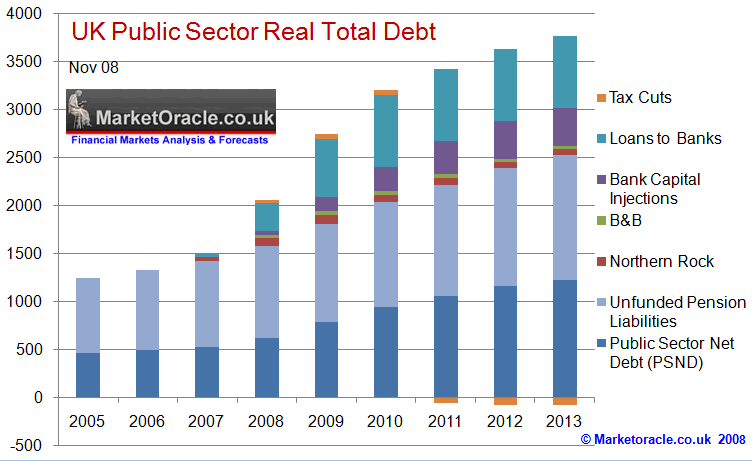
The below graph illustrated that tax payer liabilities are expected to bust above £3.5 trillion by the end of 2012, however recent events put Britain AHEAD of schedule, especially if as the mainstream media and economists are also now starting to realise that the British banks are sitting on liabilities of £5 trillion and that if they are all nationalised both publicly such as Northern Rock or through the backdoor such as RBS, HBOS / Lloyds, then the markets will discount this liability by selling out of the currency and marking the UK bonds down as at a greater risk of default. Both of these market reactions has the effect of increasing the costs of servicing the debt as the value of the debt rises in terms of foreign currencies and bond holders demand higher rates of interest to hold British debt i.e. higher interest rates even if only on the longer end, as short-term have been slashed to prevent a deflationary spiral that continue to target a trend towards zero.

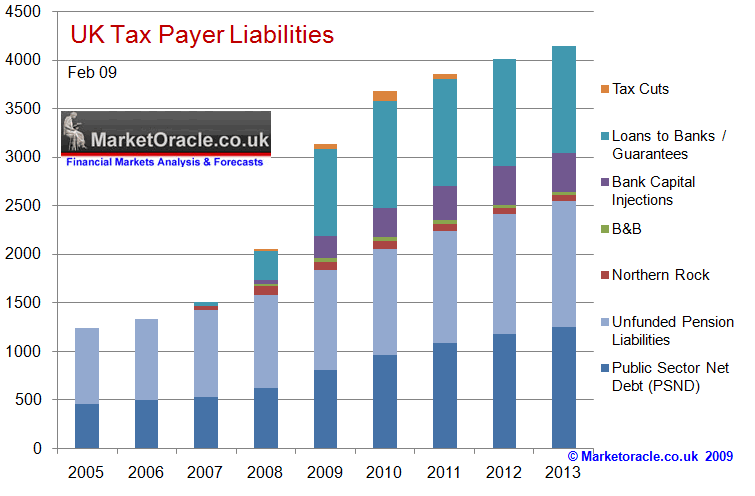
Therefore the updated UK liabilities graph is as follows which brings forward loans to the banks scheduled for 2011 to this year, as well as increasing the total by 2010 to £1.1 trillion from the original £750 billion as follows :

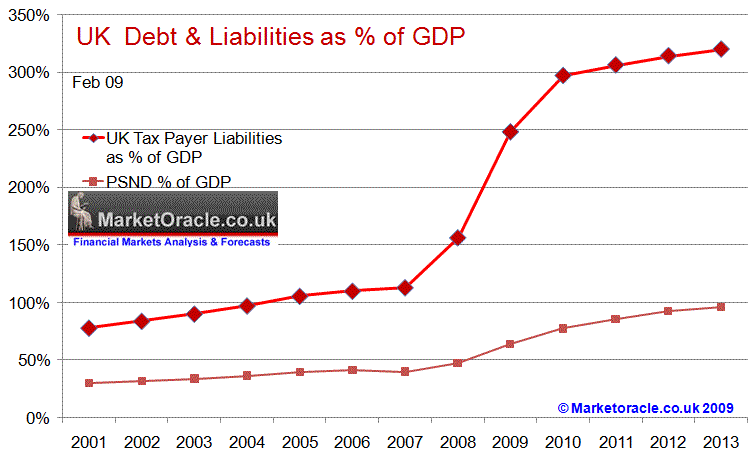
The size of the liabilities as a percentage of GDP also rises in the face of forecast GDP contraction of 6.3% ( UK Recession Watch- Britain's Great Depression?). Total PSND is expected to rise to 100% of GDP, however this abysmally fails to report the true extent of tax payer liabilities which cannot be hidden from the financial markets and in that respect total liabilities are expected to soar during 2009 from 150% of GDP to 250% of GDP with budget deficits continuing to lift debt levels to above 300% of GDP by the end of 2010, this is set against the November 08 estimate of total liabilities by the end of 2010 of 250% of GDP.

By Nadeem Walayat
http://www.marketoracle.co.uk
Copyright © 2005-09 Marketoracle.co.uk (Market Oracle Ltd). All rights reserved.
Nadeem Walayat has over 20 years experience of trading derivatives, portfolio management and analysing the financial markets, including one of few who both anticipated and Beat the 1987 Crash. Nadeem's forward looking analysis specialises on the housing market and interest rates. Nadeem is the Editor of The Market Oracle, a FREE Daily Financial Markets Analysis & Forecasting online publication. We present in-depth analysis from over 250 experienced analysts on a range of views of the probable direction of the financial markets. Thus enabling our readers to arrive at an informed opinion on future market direction. http://www.marketoracle.co.uk
Disclaimer: The above is a matter of opinion provided for general information purposes only and is not intended as investment advice. Information and analysis above are derived from sources and utilising methods believed to be reliable, but we cannot accept responsibility for any trading losses you may incur as a result of this analysis. Individuals should consult with their personal financial advisors before engaging in any trading activities.
Attention Editors and Publishers! - You have permission to republish THIS article. Republished articles must include attribution to the author and links back to the http://www.marketoracle.co.uk . Please send an email to republish@marketoracle.co.uk, to include a link to the published article.
Nadeem Walayat Archive |
© 2005-2022 http://www.MarketOracle.co.uk - The Market Oracle is a FREE Daily Financial Markets Analysis & Forecasting online publication.


