


Stock Market Trends March 2009: Bear Market Targets S&P 600
Stock-Markets / Stocks Bear Market Mar 06, 2009 - 07:11 PM GMTBy: Hans_Wagner

 To identify the stock market trend, it is best to begin with the big picture in mind and then work our way down to weekly and then daily views of the charts. You will notice that the chart and the value of the indicators change as we move from a monthly to a weekly and then a daily chart. This is a normal part of the technical analysis.
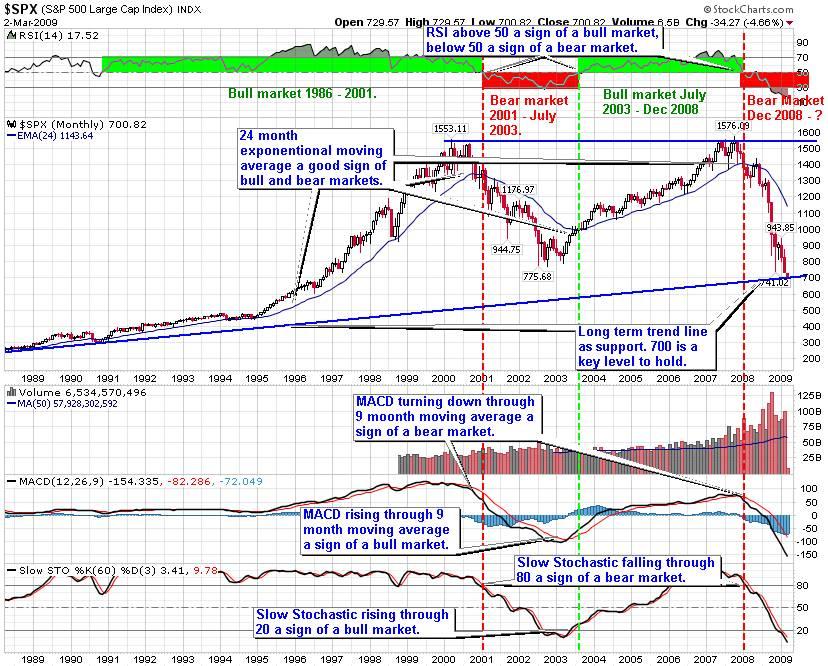
The bull market of the last five years broke down as the S&P 500 dropped through the 24-month exponential moving average. The RSI is below 50 indicating a downtrend is in place. The MACD turning down through the nine-month moving average is a sign we have entered a bear market. In addition, when the Slow Stochastic fell through 80 was another sign of the beginning of a bear market. As shown it is best to have confirming indicators to be sure the market has turned, either down or up.
Since this index is the one used by professional traders, it is important to understand how it is performing. This chart is also excellent at defining the longer-term trends for the market.
The S&P 500 is now encountering an up trend line that has been in place for more than twenty years. It is providing resistance at the 700 level. If this level holds, we are likely to see a rally. If it fails, then the market will continue to fall further.
We remain in a bear market that has had the steepest decline ever.
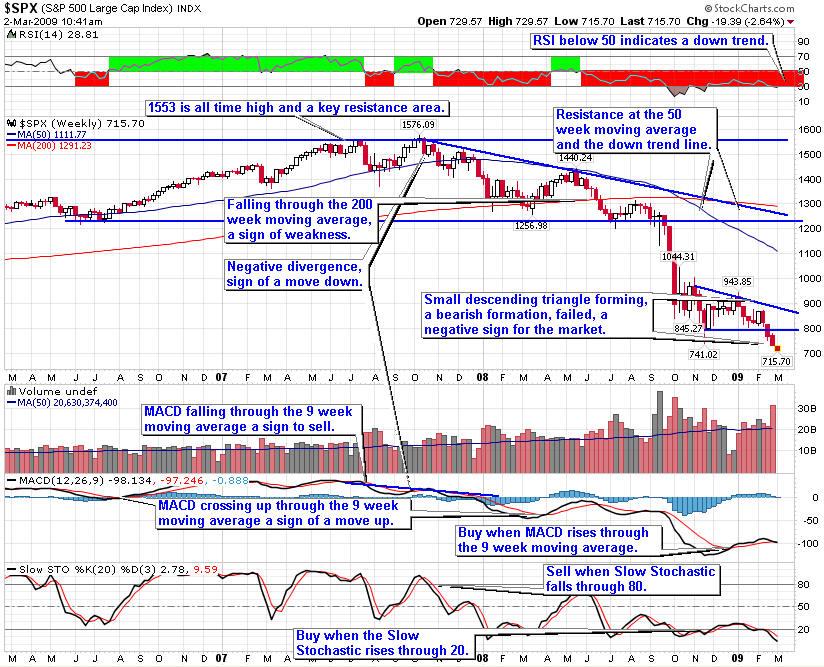
The three-year weekly S&P 500 chart shows more closely the transition from a bull to a bear market. So far the descending trend line and the 50-week moving average are the primary resistances for view this view of the bear market.
Most recently, the index formed a descending triangle pattern, a bearish formation. In February, it fell through support. Look for further weakness, though we could see a back test of the 800 level.
RSI below 50 indicates a downtrend. MACD turned up through the nine-week moving average, a buy sign. However, it is turning down again. Slow Stochastic turned back down through 20, a sign of weakness.
Long-term the trend in the stock market is still down. The break of this pattern to the downside indicates the market remains weak.
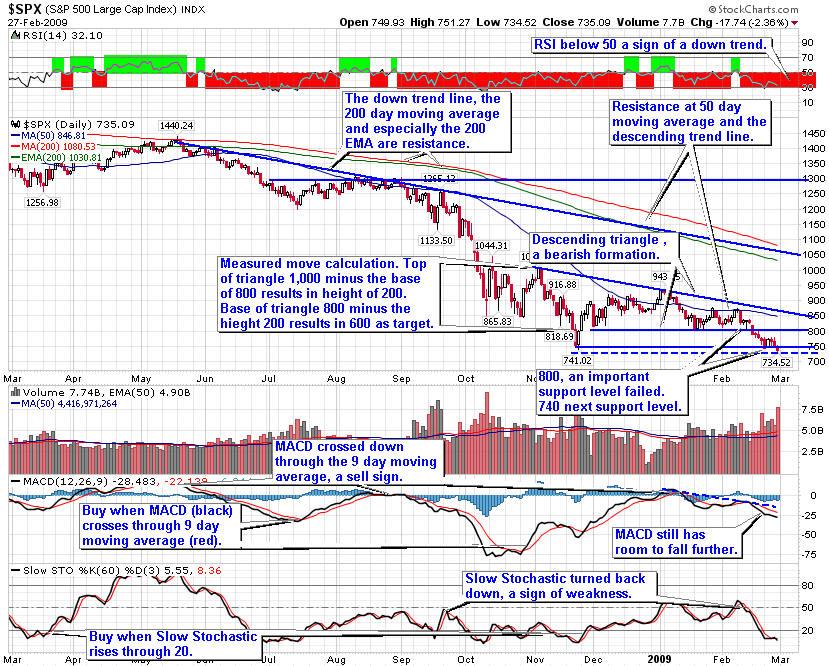
In the daily S&P 500 chart, we can see the formation of a descending triangle pattern. The S&P 500 broke through support at the 800 level and continues to fall.
RSI is below 50 indicating a downtrend. The MACD turned down through the nine-day moving average, a sell sign. The slow stochastic turned down just above 50, a sign of weakness.
The break down through the 800 level of the descending triangle is a sign of further weakness in the market. Moreover, the pattern gives us a target of 600 on the S&P 500. This does not mean the index will fall there in a straight line. Rather, we could see a rebound at the 700 level, possibly back to 740 or 800, before the index turns down again.
A measured move is a way technicians determine a price target based on a technical pattern. The theory is the market tends to move in equal increments or waves. For a descending triangle, the price target is equal to the height of the triangle after a break of support. For this descending triangle, the top is 1,000 and the base is at 800, resulting in a height of 200. Subtract 200 from the base of 800 gives you a price target of 600.
In bear markets, it is best to be nimble and/or use risk protection such as trailing stops, protective put options and even covered call options. On a sign the market is unable to penetrate resistance, you might consider using the short and ultra short Exchange Traded Funds (ETFs).
Given this perspective on the trend of the stock market, it is important to have your portfolio positioned for a fall to 600 on the S&P, should 700 not hold as support. This means investors should assess their long positions to reduce risk. When the market falls during a bear market, you should either be in cash or be short. The short and ultra short ETFs are good ways to short the market without having to depend on selecting specific stocks.
While it is tempting to buy when the market falls, a better strategy is to be sure the stock market trend is in your favor. Most likely the prices of many companies will be even lower. Following the stock market trend works. That doesn't mean you cannot buy high quality companies that are in sectors that are trending up. Just keep in mind, Warren Buffett's first rule of investing is to not loose money. Patience is key when markets are moving down.
By Hans Wagner
tradingonlinemarkets.com
My Name is Hans Wagner and as a long time investor, I was fortunate to retire at 55. I believe you can employ simple investment principles to find and evaluate companies before committing one's hard earned money. Recently, after my children and their friends graduated from college, I found my self helping them to learn about the stock market and investing in stocks. As a result I created a website that provides a growing set of information on many investing topics along with sample portfolios that consistently beat the market at http://www.tradingonlinemarkets.com/
Copyright © 2009 Hans Wagner
Hans Wagner Archive |
© 2005-2022 http://www.MarketOracle.co.uk - The Market Oracle is a FREE Daily Financial Markets Analysis & Forecasting online publication.