Stocks Bear Market Takes a Break as Dow Targets 8,000
Stock-Markets / Stocks Bear Market Mar 12, 2009 - 05:23 PM GMTBy: Oxbury_Research

 Wall Street breathes a temporary sigh of relief, rallying for three rare days in a row now. Capital infusion for banks, upbeat news from Citigroup of a profitable year-to-date and a General Electric credit rating cut that was less dramatic than previously anticipated have all contributed to a Dow poised to take advantage of all the money market funds sitting on the sidelines. Valuations are becoming more and more appealing to the average investor out there. The chops are indeed being licked…
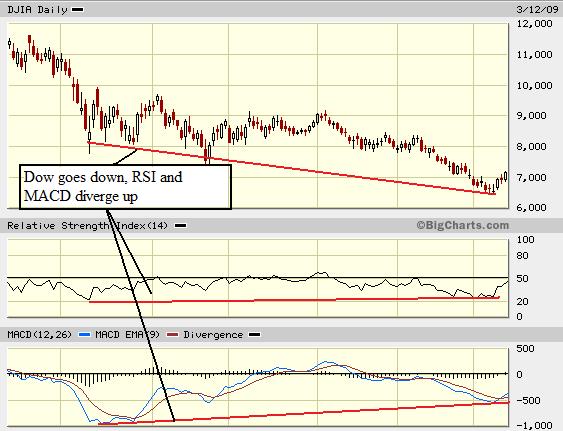
Let's head to the charts. Below, I have discovered a bullish divergence. Divergences occur when the price of a security or index goes one way and the indicator(s) of choice go in the opposite direction. In this case, the Dow was trending down. I needed at least two connecting points, which we were fortunate enough to establish recently.

Next, we compared those same two endpoints with some key technical indicators. Powerful indicators such as the Relative Price Strength and Moving Average Convergence Divergence (MACD) give us plenty of bullish ammunition. As you can see, both indicators were trending up while the Dow continued to slide. The thing about divergences is that price is the lag. Eventually the price will need to shift course and reverse to match that of the indicator. And this, my friends, is why understanding divergences can be such a powerful took to add to your investment arsenal.
If the Dow shows a possible reversal, how high can we go? Well, this is a matter of watching key resistance levels closely. This means that I'll be keeping my eye on the battles that will be fought near 7,500 and 8,000. Other resistance levels above this point are useless to even touch at this point. With that said, I think there's a short window of opportunity to capture profits to the upside, but be prepared to pull gains if buying volume on the way up is lighter than the daily average over the past six months or so.
In the end, I would probably see this as nothing more than a bull rally in an overall bearish market. Even the bears need a break once in a while. If/when the tide turns back the other way, hopefully we'll be given another clear signal to act upon.
Good investing,
Stanley Barnes
Analyst, Oxbury Research
Disclosure: no positions
Oxbury Research originally formed as an underground investment club, Oxbury Publishing is comprised of a wide variety of Wall Street professionals - from equity analysts to futures floor traders – all independent thinkers and all capital market veterans.
© 2009 Copyright Oxbury Research - All Rights Reserved
Disclaimer: The above is a matter of opinion provided for general information purposes only and is not intended as investment advice. Information and analysis above are derived from sources and utilising methods believed to be reliable, but we cannot accept responsibility for any losses you may incur as a result of this analysis. Individuals should consult with their personal financial advisors.
Oxbury Research Archive |
© 2005-2022 http://www.MarketOracle.co.uk - The Market Oracle is a FREE Daily Financial Markets Analysis & Forecasting online publication.


