


Natural Gas Bottom?
Commodities / Natural Gas May 13, 2009 - 06:08 PM GMTBy: Q1_Publishing

 The market recovery has helped out a lot of sectors. Leading commercial REITs have been raising cash. Funding for high-potential biotech stocks has resumed. Beaten up casino stocks have done exceptionally well.
Throughout the first eight weeks of this rally, natural gas prices seemed to fall week after week. Inventory continued to set new highs practically each week. Every round of price declines brought a further decline in natural gas rigs in operation. Last week another 17 rigs were taken off line according to Baker Hughes (NYSE:BHI).
Despite all the bad news for natural gas, it looked like natural gas prices were sitting a bit too low. In the Prosperity Dispatch article Natural Gas: 5 Reasons to Buy the Other Fossil Fuel Now we looked at a few reasons why natural gas prices were about to rebound.
The key catalysts we identified for a quick rebound over the short term were new supplies are shrinking (rigs are getting shut down), near-term outlook is bleak (large short interest), and the energy value of natural gas relative to oil in dollar terms was getting way out of line.
That all changed last week and natural gas prices started to rebound. In all, natural gas prices rebounded sharply from a bit under $3.25 per Mcf to $4.52 as I write. That’s a 40% move in a little over a week.
So now the big question on investors’ minds is, “Was that the bottom?”
To answer it, we have to look at a couple of factors.
An Uptrend Forms
One of the most important factors is rig counts. The number of rigs exploring for new reserves and expanding old reserves is closely related to how quickly supplies will be able to be replenished if demand resurges.
If you look at the chart below the decline in operational rigs is starting to slow:
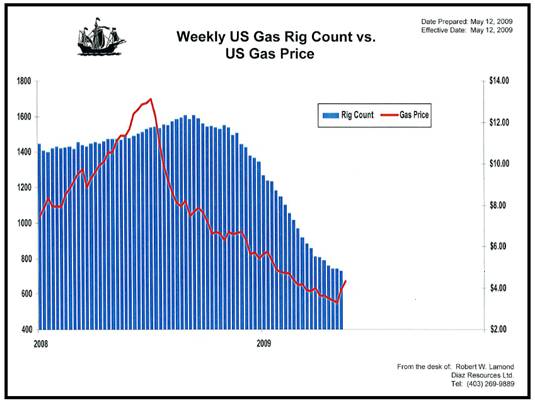
The leveling off of the number of rigs in operation is an important part of the bottoming process. But it’s not all of it though.
Prices are what we’re watching here (and where we’re going to make any money). The chart above also shows there is some signs of life for natural gas in the near term.
Now with the rig counts down – all the way to levels from five years ago – and natural gas prices rising, is the mix right for a long and steady rebound to $5 per Mcf, then $6, and beyond.
It’s 2004 all over again, right?
Well, not so fast.
A Bumpy Road Ahead
The first thing is that there is a lot of supply to get worked off. Current inventories are sitting at near record levels for this time of year. It will take a big rebound in demand to get the natural gas stockpiles back down to average levels. Right now, the two most variable demand drivers are very unpredictable.
On the industrial demand side of the natural gas equation, it’s not looking very strong. The U.S. Department of Energy recently said industrial consumption of natural gas will decline 8% this year.
The real variable here is actually the weather. Remember, natural gas-fired generators are very expensive to operate and make up most of the marginal electricity generation capacity. Demand from those generators is tied closely to marginal electricity demand which, in the summer months, is tied closely to air conditioners usage. As a result, a mild summer on the west and east coasts (where air conditioning usage has the greatest impact) could go a long way to keeping demand down.
Then after the summer, there’s another major hurdle which will keep a price cap on natural gas prices. In the fall, the U.S. will see a large influx of natural gas imports from all over the world.
In Liquefied Natural Gas (LNG): The Energy Boom Everyone Forgot About we looked at how a surge in additional LNG production capacity is coming on line soon:
An additional six liquefaction plants will come on line by the end of this year. These facilities will produce a lot more LNG. Together they will nearly double global LNG production over the next few years.
For instance, the massive Sakhalin II project off the coast of Eastern Russia just shipped its very first LNG shipment to Japan a few days ago.
An expansion of the liquefaction plant in Indonesia is expected to come on line by the end of the year.
And then there’s the big one. QatarGas’ liquefaction facilities are going through a major expansion. This project will bring an additional 24 million tonnes of LNG on the market this year. That’s nearly a 30% increase in LNG supply overnight.
The LNG boom is only going to grow from here. According to a recent LNG article at Bloomberg suggests:
The flow of LNG into the U.S. will be about 500 billion cubic feet compared with 350 billion cubic feet in 2008, according to the monthly report. The new estimate is a 4.2 percent increase over last month’s projection. Next year’s imports may rise to 650 billion cubic feet, the department said.
“Expected weak natural-gas demand in the liquefied natural gas-consuming countries of Asia and Europe, the startup of new liquefaction capacity, and limited natural-gas storage capacity in countries that typically rely on LNG are expected to increase the availability of LNG for the U.S.,” the [U.S. Department of Energy] department said.
There are billions of dollars being invested and the industry has years of growth ahead of it. The impact of LNG on natural gas prices in North America will only grow from here.
A Range bound Future
It’s clear we’re at a midpoint in natural gas price range. They could easily go up or they could just as easily go down. There are many unpredictable factors at play. As a result, I recommend waiting for the extremes to go long or short.
The downside extreme would be under somewhere around $3.50 per Mcf. If a mild summer rolls through or industrial demand falls further, there would be little support for prices above $4 per Mcf.
The upside extreme would be around $5 or $6 per Mcf. It would take a strong surge to get prices comfortably above $5, but it’s not impossible.
Also, if that surge does happen, there will be plenty of LNG headed for North America to help supply any surge in demand at those prices. Remember, the cost of production and delivery of LNG is between $2.90 to $4.00. That range includes both variable and fixed costs. So, considering the high case scenario, there will be plenty of foreign natural gas coming into the U.S. when natural gas prices reach beyond $5.
In the end, it’s too early to tell if natural gas prices have hit the bottom. But if we wait for the extreme scenarios, there should be some easy money to be made playing the range with a covered call or covered put strategy on U.S. Natural Gas Fund (NYSE:UNG) or quicker trades in the Horizon’s Betapro Natural Gas Bull Fund (TSX:HNU) or its Bear equivalent (TSX:HND).
It’s tough to imagine a significant breakout beyond mid $5’s and low $3’s at this point so all bets at those points should be pretty safe and profitable.
Good investing,
Andrew Mickey
Chief Investment Strategist, Q1 Publishing
Disclosure: Still long Horizon’s Betapro Natural Gas Bull Fund (TSX:HNU) from previous drop in natural gas prices.
Q1 Publishing is committed to providing investors with well-researched, level-headed, no-nonsense, analysis and investment advice that will allow you to secure enduring wealth and independence.
© 2009 Copyright Q1 Publishing - All Rights Reserved
Disclaimer: The above is a matter of opinion provided for general information purposes only and is not intended as investment advice. Information and analysis above are derived from sources and utilising methods believed to be reliable, but we cannot accept responsibility for any losses you may incur as a result of this analysis. Individuals should consult with their personal financial advisors.
Q1 Publishing Archive |
© 2005-2022 http://www.MarketOracle.co.uk - The Market Oracle is a FREE Daily Financial Markets Analysis & Forecasting online publication.