Crude Oil, Gas, and Gold Seasonal Trend Update
Commodities / Commodities Trading Aug 07, 2009 - 10:13 AM GMTBy: Bill_Downey
 Commodity speculators and investors (women excluded) can learn a lot by observing the purchasing habits of the “woman of the house.” Obviously it’s not in all cases, and the statement is a generalization of the observations that some of us have which as you’ll read is very complimentary and helps me make a point. Rather than call this a woman’s job, it’s really a job that men are horrible at and women quite frankly have to execute for the household. (Yes, many men can do it, I’m generalizing) Although sometimes women are accused of being big spenders or not careful. However in most cases and I think you’ll agree, when you look really close, most women are very savvy and educated consumers.
Now when it comes to purchasing commodities for the house, recall how the approach and purchases are made? Whether it’s back to school, Christmas, Easter, spring, fall, summer or winter, women can be very deliberate in their purchases.
So what do they do?
Quite simply, they are experts at knowing the seasonal aspects of the shopping season. They know that entry into that season begins with a SALE. This is a call to LOW seasonal prices as merchants begin their sales to consumers. This low price starts to move the inventory and get things going. The smart shoppers have their list early, and they check the trades (newspapers, TV, internet) and sniff out the good deals. They also know that at the end of the season, if inventory is left, it has to be moved out of the stores. Enter the “END of SEASON” sales. You see them every season. Christmas is probably the best known, but all seasons and holidays have a clearance sale at the end. Smart shoppers again take advantage of this too as they round out their seasons.
Commodity and precious metal investors and speculators should take a cue from above and try to improve their shopping skills. One would go about it simply by keeping track a little more about the seasonal aspects that commodities have as they have their seasons also. For instance, this is the time of the year that Oil, Gas and Gold and Silver have their seasonal rise as demand usually comes into the market this time of the year.
So shoppers, get your scissors out while we review where the deals are:
First up tonight is the Natural Gas market. There’s been a huge position taken in natural gas via the ETF called United States Natural Gas Fund (UNG). This buildup of volume has been gathering since May of this year and picked up heavy in June and July. As we can see by the seasonal chart below, the participants are anticipating a run up in Nat Gas as this chart suggests that the best rallies come this time of year. For Nat Gas, weather is a huge factor and it is no coincidence the chart reflects the hurricane season for the United States. So let’s look and see where we are with price.
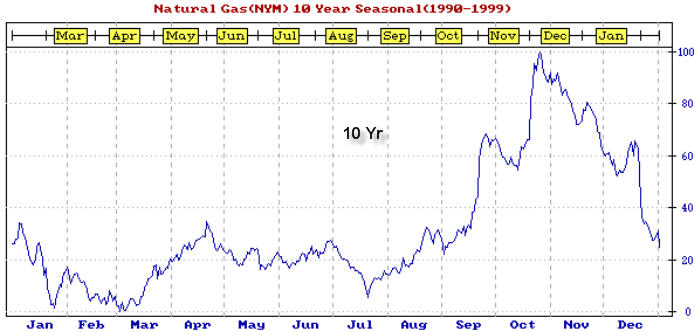
In early July I wrote an article on the subject of price and the seasonal. I suggested then that August might be a more appropriate time as the inventory overhang in Nat Gas is not small and in this environment, you always hear about the new discoveries. I’ve also discussed in an article last week the pros and cons……….well, actually, just the cons as I see them in using UNG as a vehicle to invest in Nat Gas. We can see that
UNG has in fact drifted lower into the end of June and into July, and now seems to be trying to make a seasonal turn. And look at Nat Gas. It seems to be doing the same. But there is another important aspect of these two charts. If commodities weren’t speculative enough, how about UNG ? IF we look at Nat Gas, it indeed has been a bear market. It’s gone from about 14 to 4. That’s a 72% drop. And now a quick glance at UNG and the drop is even greater at 80%. More interesting is the fact that Natural Gas has rallied from the $3.20 area to $4.07.
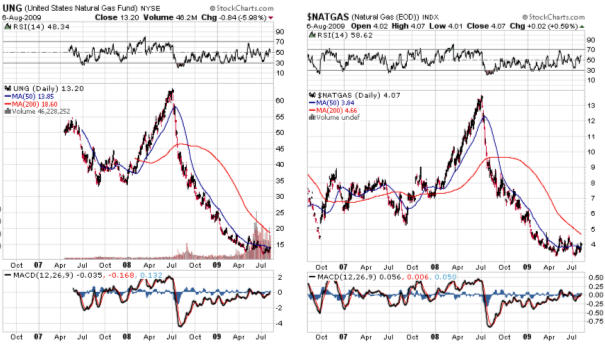
That’s a 21% percent gain from the lows. How has UNG fared? They’ve gained 11%. The question becomes how well will UNG track Nat Gas? To get to the crux of the discussion, the question is this. Is there a vehicle that can FOLLOW SPOT NAT GAS prices? If you Google “Gold, Crude Oil or Natural Gas” or check the archives on this website, you can read the full details of what I researched on UNG.
In an earlier report in June, “What’s up with Natural Gas,” I tackled a similar question. What is a good vehicle one might use to play Natural Gas?
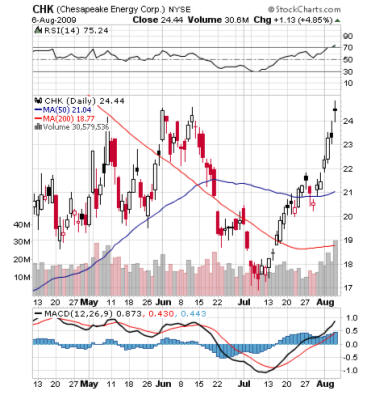
In that example I used a company called Chesapeake Energy where I suggested might make not necessarily a good proxy for Nat Gas, but a way to participate should there be a Nat Gas rally. At the time the stock was trading at 19.64. Its moved almost to the 25 area.
The purpose is to not try to sell you on this particular company, but as an example suggesting you might want to do research so as to carefully choose your Nat Gas vehicle (no pun intended!). As you can see, this stock seems to have taken off right at the seasonal trend change, i.e.; July. It’s had a 33% run from its bottom.
The bottom line is this: If you want to invest in Natural Gas and play its seasonal run, make sure you have researched and looked at the various ways to play it. A company will obviously have more POTENTIAL problems that can occur. But it also for a number of reasons could rise in price EVEN if Nat Gas doesn’t. In Nat Gas, price is the only factor. Keep that in mind. There are a lot of companies in this industry whose stock is NOT going up this time of year. So when you play the natural gas seasonal, make sure of your investment vehicle. Seasonally, if there is to be a rally, it’s usually now. Depending on its strength will depend on how long the rally will last.
Crude Oil
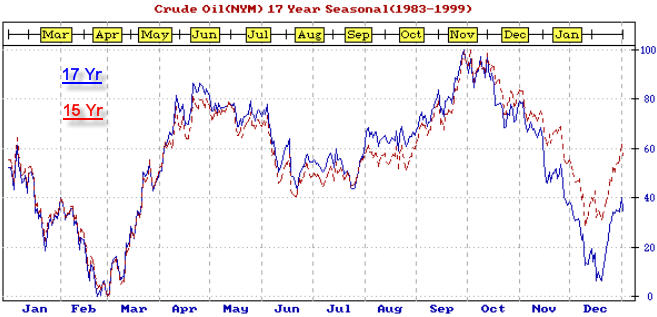
On the chart below, the crude oil shopping season has been under way since last February according to the seasonal chart. The crude oil chart has also been reflecting the same thing. In fact we are nearing the seasonal (AVERAGE) end of the shopping season. Prices on average usually peak at the end of September. I say usually because in a STRONG DEMAND or geopolitical year or any year you want to call it, Crude oil can rally right into the end of the year.
So a commodity player who is a smart shopper looks for crude at the end of the winter months and is one who on average (in this example) would be looking to rid themselves of Crude or at least LIGHTEN up the position if one sees price weakness as the fall months arrive.
If everything played out just right, a smart shopper would be slowly phasing over from Crude Oil to Natural Gas at this time of the year. However, remember, each year has their own peculiarities and with the way the markets of today are rigged (pun intended) one has to take a careful approach and be cognizant that not every seasonal plays out. Because when a contra-seasonal move develops, price can be crushed. That’s when seasonal players are on the rally side, and the DEMAND for the year doesn’t materialize and a selloff develops. The seasonal longs look to exit and there’s NO ONE to buy. It can and does happen.
That is why one must always employ stops. When you’re in the strongest part of the year and your commodity is NOT responding it’s already telling you something. For what ever reason it’s weak when it shouldn’t be. I don’t know about you, but that’s about all it takes from me to clear my position and possibly even look for an ETF that bets on the downside. Ironically, the money in markets is only made at the hardest times. It’s tuff to exit crude positions of your favorite stocks when crude has doubled. Smart shoppers know not only when to buy, they also know when to sell at least SOME of their commodities.
The chart on the left below is an ETF type called OIL. The one on the right is called DXO. The one on the right is supposed to return double of crude oil price increases. It bottomed at the $1.75 area and went to $5 so it’s doing its job of keeping ahead, but not doubling. On the left hand chart the return is less. This vehicle description is:
The investment is linked to the performance of the Goldman Sachs Crude Oil Return Index and reflects the returns that are potentially available through an unleveraged investment in the futures contacts comprising the index plus the Treasury Bill rate of interest that could be earned on funds committed to the trading of the underlying contracts. The index is derived from the West Texas Intermediate (WTI) crude oil futures contract traded on the New York Mercantile Exchange. The fund is non-diversified

So while the crude oil season peaks in the fall do the charts say we should be selling? NOT if they still look like this. And that is a MAJOR key on how to play it. Since we don’t know the exact lows and where they will be, if the CHART and PRICE is strong you might LET IT RUN until it stops going up. Then you take some profits. Right now, the 50 day has crossed over the 200 day, price is making new highs. The chart is in strong condition. It’s still in an uptrend. Now as far as DXO goes (chart on the right), this is and can be a quick mover down too as it is a DOUBLE mover. Research in price performance indicates these types of stocks require good timing. Each play requires a strategy and you should have one for each investment you do. I am using these two stocks as illustrative and you should not construe this example as a buy recommendation.
The bottom line is: In crude the shopping season on average will take a dip from sometime in the fall and then usually bottoms out in mid to late winder. Smart shoppers do there shopping around that time of the year. Right now the smart shopper is one who might choose to look at and review each investment in their portfolio or accounts of crude oil related investments and maybe rid a few losers, and trim a few shares off of the great gainers always looking to rebalance you holdings.
Gold
How about gold and its performance over the last decade? Are the bulls going to finally have their way? Well from a timing standpoint, GOLD is certainly at bat and at the PLATE. I think the only thing that can stop gold from hitting a home run is the pitcher. He’s a veteran from the old team……..what’s their name? Ummm. Oh yea. The Washington Federals, that’s their name. The FEDS for short. From what I hear the pitcher has an arsenal. When confronted, he can deliver the following: A fast ball, a curve, a slider, and when things get tough, a knuckle ball and a fork ball. When none of those work, he throws his strikeout pitch. THE SCREW BALL. Gets em every time. (LOL – little humor there.)
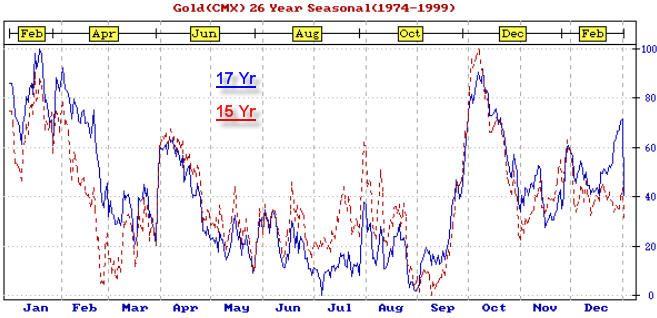
In gold we see a market that is ripe for a seasonal move. The month of September on average produces the sharpest rallies and many a low has been set during this timeframe. The Sept thru February timeframe is gold’s season and the shopping season usually starts near labor day but in all honesty, can be as late as October and even November sometimes. That is why it is so important to know when big trends start. It is the key to being successful in speculating in gold. Long termers can still benefit from this because by following the seasonal, he/she will know the optimum times to buy.
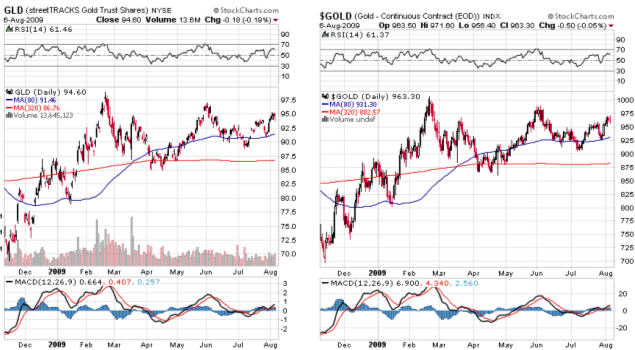
In gold, using GLD as an ETF vehicle, we can see throughout this year it has traded in a very narrow band and has spent the year trying to reach and get above 100. In fact it has spent 17 months trying to breach the 1000 area. Is this going to be the time? Odds favor this time of year. But will it ? Sometimes it is best to allow the market you’re following to just make a new high and breakout before jumping in head first. One key will be the US Dollar and how it performs.
From a pure investment/speculation perspective, gold has a lot going for it. It’s actually less volatile than the oil and gas markets, and gold can also be stored as a means of capital preservation. The beginning of petroleum products came as a substitute for ………….WHALE BLUBBER. The beginning of gold was pretty much at the dawn of civilization. By then, a standard means of barter was needed and gold was established. It has held the test of time. There could new methods of energy that will be invented in the future that will modernize the world, and make fossil fuels no longer required for mass transportation. But there will never be a NEW real global means of re-inventing money in substitute for gold. We know that because we are going through the results of invented money now in the global community. Taint working !
Conclusions
Each of these commodities have their seasonal ebb and flow. Each have various price movements, sometimes strong, sometimes weak. While these commodities usually rise and fall together, we have seen today that there are slight difference. Crude is usually a buy in late winter early spring. GOLD is usually a SELL right before that, in early February. Crude is now approaching the end of its seasonal strength, while gold and Nat Gas is just starting. On final word on Nat Gas. I went back and looked at some charts. To tell you the truth, I’ve found that the hurricane season accounts for a lot of Nat Gas rallies. So we are the season, but of all three, Nat Gas has the lowest ODDS on average of making a good buck. It’s rally season is very short, and the timing must be perfect.
Crude on the other hand, has a much better “season” to it but one should be aware that the gains for the year on average come to an end near the end of September.
Gold’s season arrives more often than not around this time of year, but can be known to have a dip in the October time frame, and sometimes it wait’s that long for the rally to even begin. Regardless of that fact, one should start scaling in when the charts begin a rallying mode. Gold’s chart certainly has powder keg written on it above 1075-1100. It says : CAUTION: DO NOT TRADE OVER $1100 PER OZ. CONTENTS CAN IGNITE AND DOUBLE.
Should a gold move develop the world will have to ADJUST to triple digit gold. There are a lot of people in who’s interest it would be to not see that. Sometimes it almost seems like the price is always halted near this level……..like for the last 17 months. One of these times a match will go near that powder keg and when it does it has the potential to change things as we know them forever. It’s that serious folks. Regardless of whether it’s up or down, make sure you know when the next TREND change occurs. If you don’t do like the smart shopper would do and call on someone for assistance with your purchase.
As we have seen each of these commodities have a “season” if you will. If you’re a smart shopper, you will become familiar with these seasons and when there are sales and when the optimum time to buy them occurs.
To receive my Free Weekly Trading Reports please visit: www.TechnicalCommodityTrader.com
May you all prosper
Bill
Bill Downey is an investor/speculator in the stock and commodity markets. He does freelance writing about various markets for clients and for himself as well as technical analysis of the Gold and Silver markets.
http://www.technicalcommoditytrader.com
© Copyright Bill Downey 2009
Disclaimer: The above is a matter of opinion provided for general information purposes only and is not intended as investment advice. Information and analysis above are derived from sources and utilising methods believed to be reliable, but we cannot accept responsibility for any losses you may incur as a result of this analysis. Individuals should consult with their personal financial advisors.
© 2005-2022 http://www.MarketOracle.co.uk - The Market Oracle is a FREE Daily Financial Markets Analysis & Forecasting online publication.


