


USD, US Treasuries, Gold, Crude Oil and Copper Charting Perspective
Commodities / Commodities Trading Aug 20, 2009 - 02:34 AM GMTBy: Garry_Abeshouse

 The change in sentiment occurring at the moment recognises that equities are overpriced. If this is the case then conservative money will certainly go elsewhere - and for now, it looks like the USD and US T-Notes and T-Bonds are it. It may also mean that gold will initially fall along with oil and copper.
Currencies
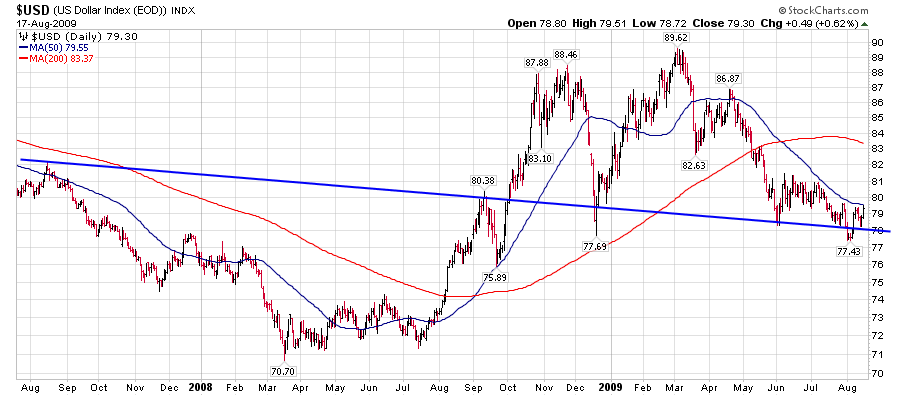
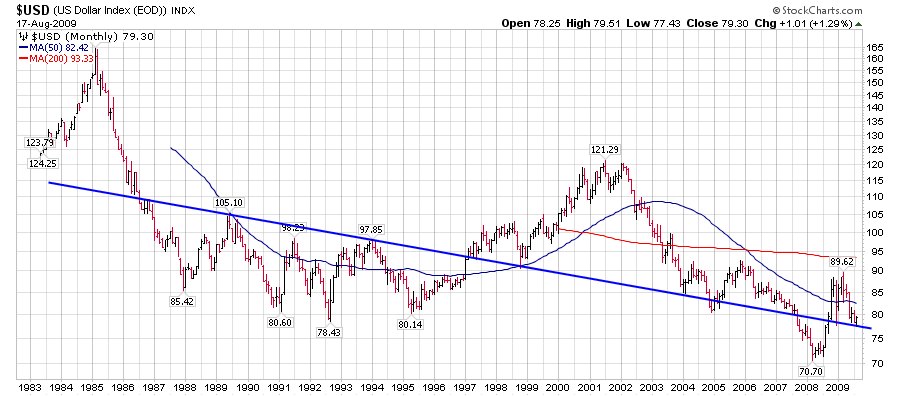
About two weeks ago I noticed the bearish talk on the USD was increasing dramatically, while at the same time the price just refused to fall. So I took a closer look at the median axis lines and pivot points, which were showing similar support stories over different time scales. Sure enough the same story kept appearing regardless of chart - daily, weekly and monthly. But the clincher was the more sensitive intraday P&F Comex charts that really began to suggest a more bullish scenario. It was all a bit of a shock really, as I have been extremely bearish on the USD dollar for a long time.
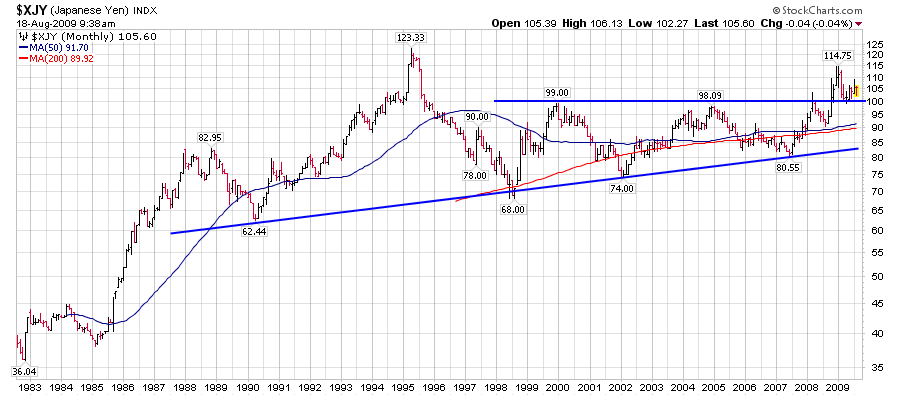
Overall the strength and size of the evolving patterns in the currency charts, suggest the possibility of an extended upward move in the USD, but there is no way I would be making uppermost projections at this stage. The highly volatile and fluid nature of currency markets at the moment, especially when there are so many unknowns about the strengths of major banks, means that upward targets need to be looked at in baby steps, one at a time. The first main resistance that must be overcome for the USD is at 81, a failure here means this whole scenario for the currencies will need to be re-evaluated. On the other side, a fall below 78 would negate the bullish scenario for the USD and change the fortune dramatically for gold.
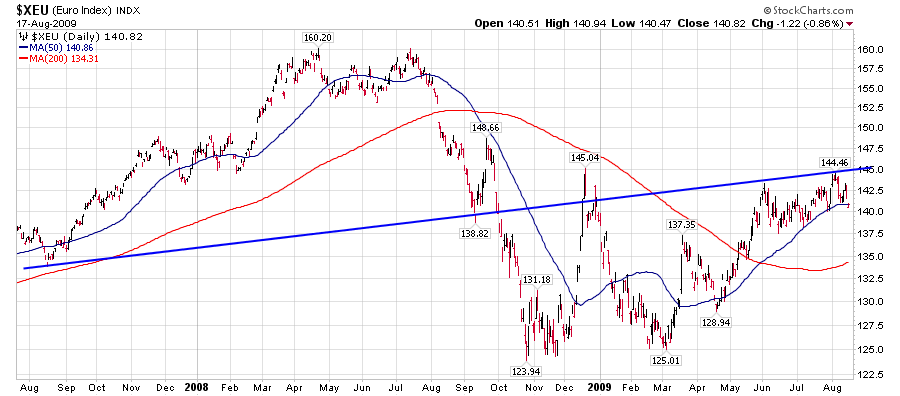
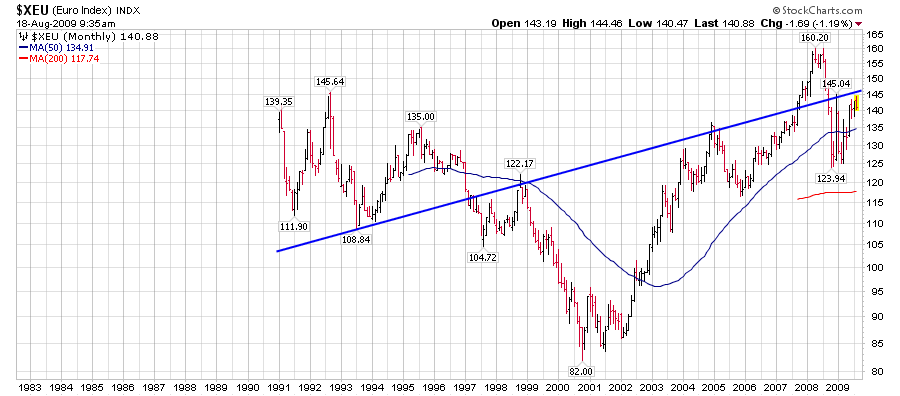
The Euro charts showed a similar story to the USD - but in reverse.
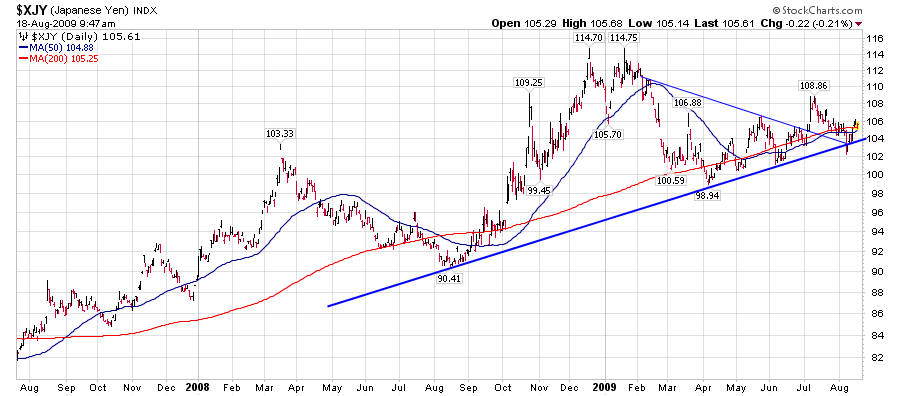
The Yen, despite Goldman Sach's recent highly bearish view, actually looks like it could move up in tandem with the USD. This is actually contrary to what has happened in the immediate past, as previously the Yen, as you can see, tended to move in tandem with the Euro.
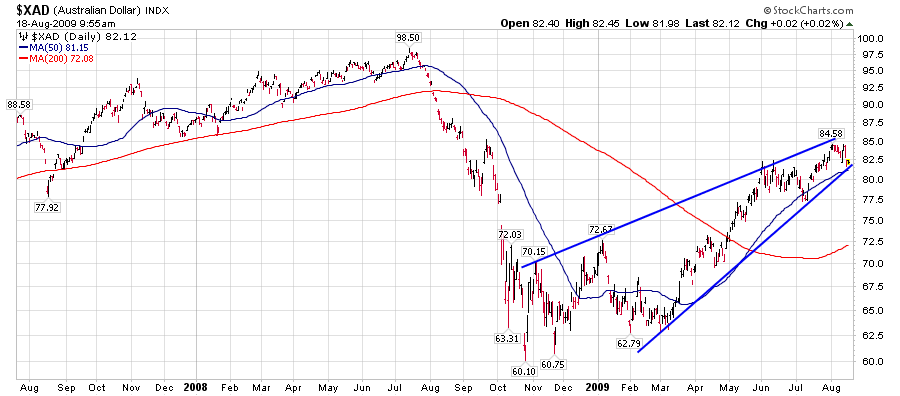
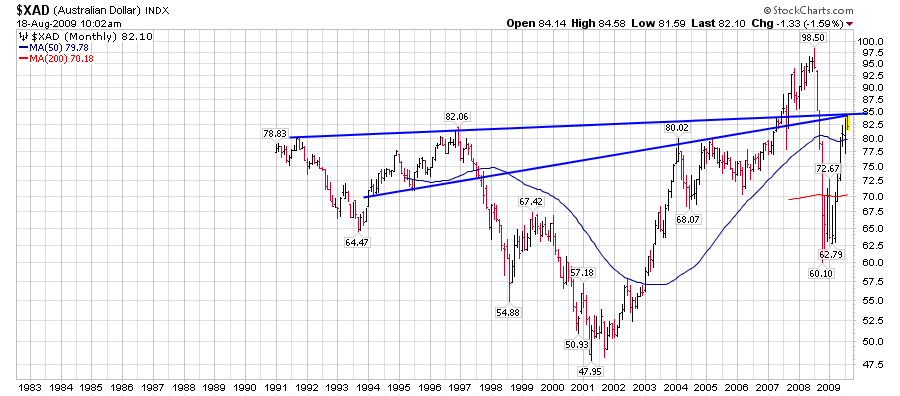
The Australian Dollar on the other hand, has been moving more or less in tandem with the equity markets, due to Australia's dependency on commodity prices, which suggests that when equities fall so will the commodities such as oil and copper - and so will the AUD as well.
The nature of the huge amount of derivatives held by the major banks - on balance sheets to the tune of $592 trillion plus an unknown amount off balance sheet, means that the whole world continues to be held to ransom by any future trading mistakes that the high flyer traders associated with these transactions may make. The nature of this beast means that it is probably inevitable that there will be a major adverse event atributable to derivatives sometime in the future. An event such as this would be highly traumatic, creating instantaneous large percentage up and down price swings in all markets.
Note that this $592 trillion of derivatives is nearly 8.5 times larger than the GDP of the entire world ($69.49 trillion) and is geared at a ratio of about 16:1. Certainly something that nightmares are made of.
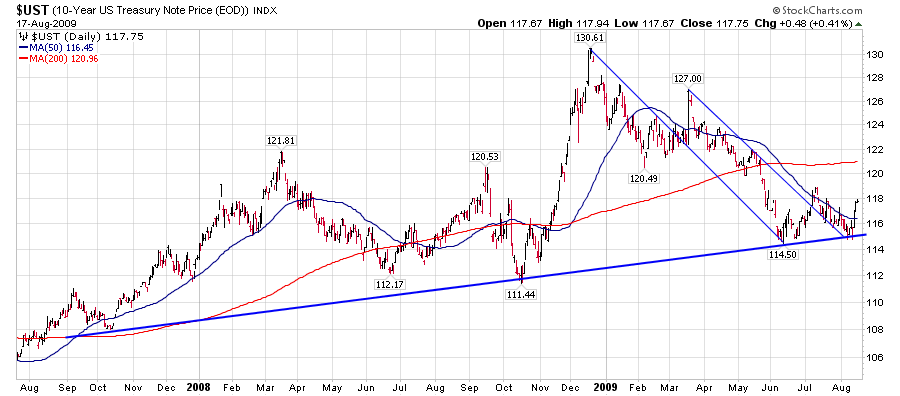
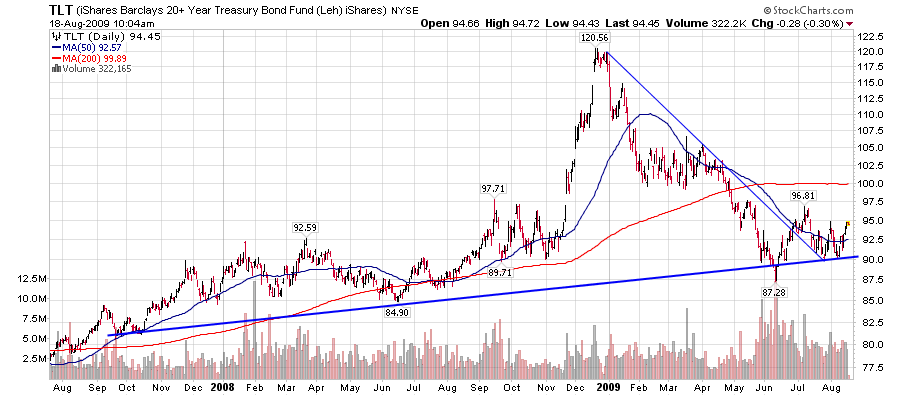
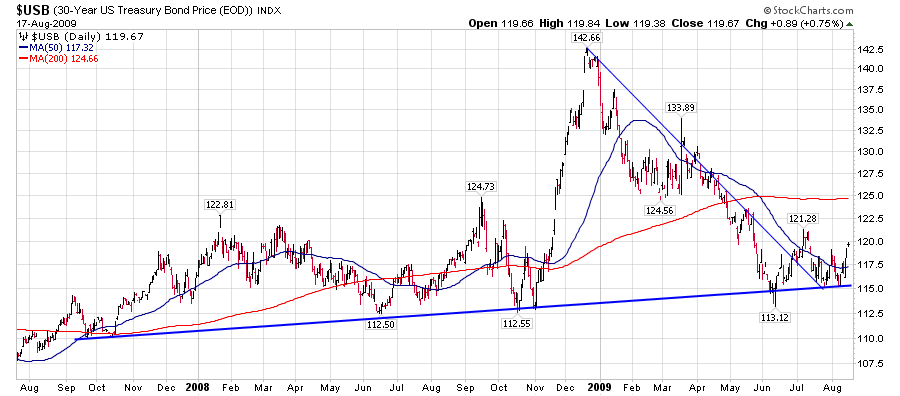
US Treasuries - 10 yr, 20yr, 30yr
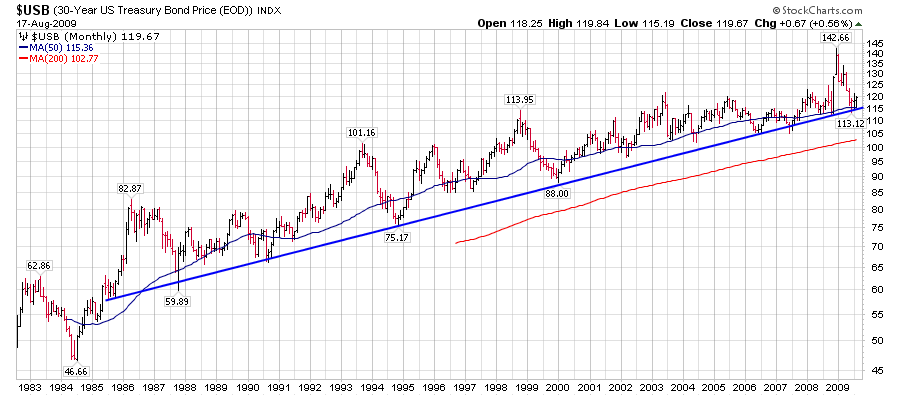
You will notice on both the daily and monthly charts, the low angle uptrends are intact and very well defined. On the daily charts you will notice the 45 degree angle downtrends have all been broken and on the 20yr chart there is a bullish volume profile as well. Treasury prices appear to be factoring in a fall in equities and initially I would be expecting an inverse relationship to prevail for the time being - as long as a certain amount of trust remains in the USD. That relationship does not extend to Corporate and Municipal Bonds however, which I expect will move down with equities. Again, as for the USD, the intraday P&F Comex charts are giving a clearer picture of a bullish style accumulation.
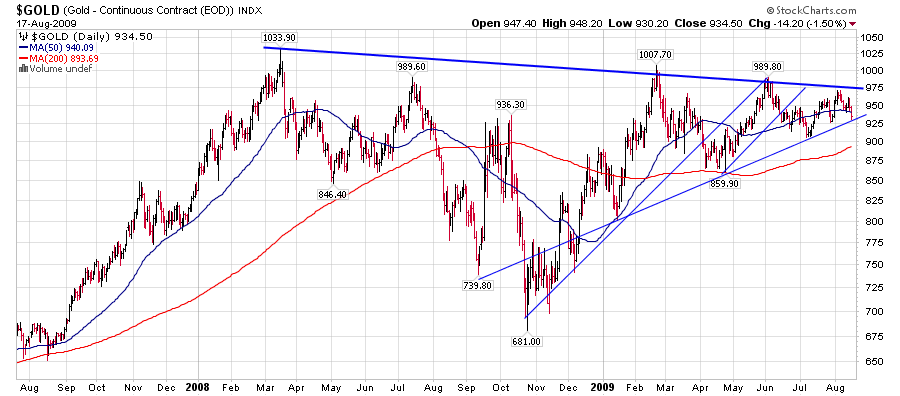
Gold
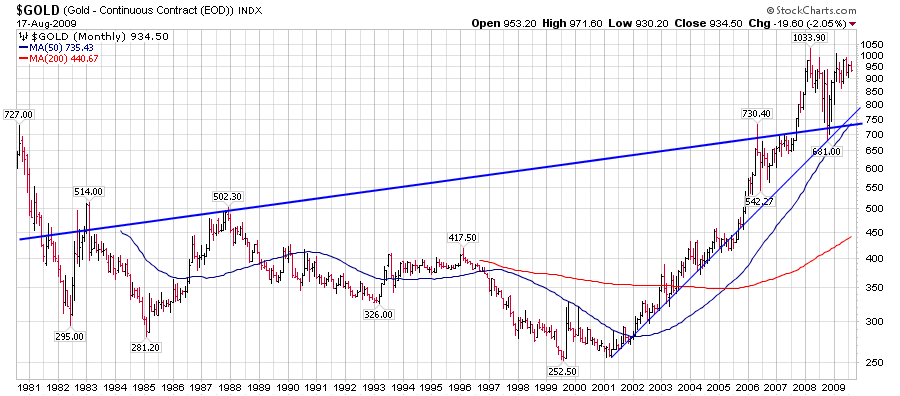
The future of the gold price now hangs in the balance, as a strong move up in the USd will almost certainly cause the price to drop, even allowing for a fall in equities as well. Where it will eventually find support depends for the most part on how high the USD goes and how far and fast equities fall.
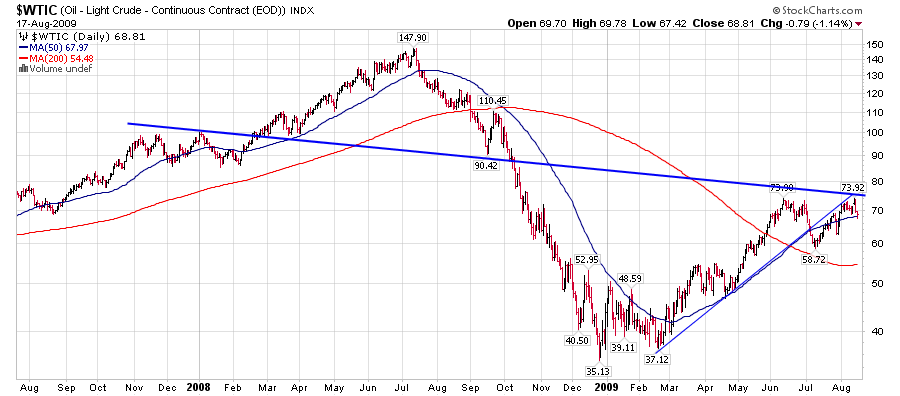
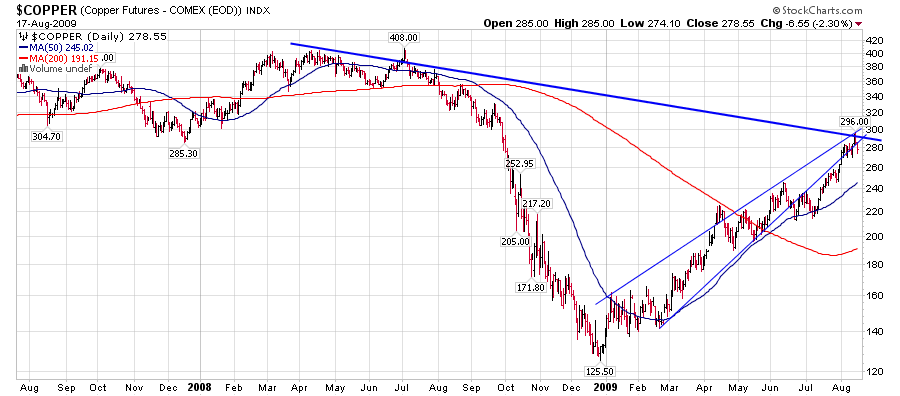
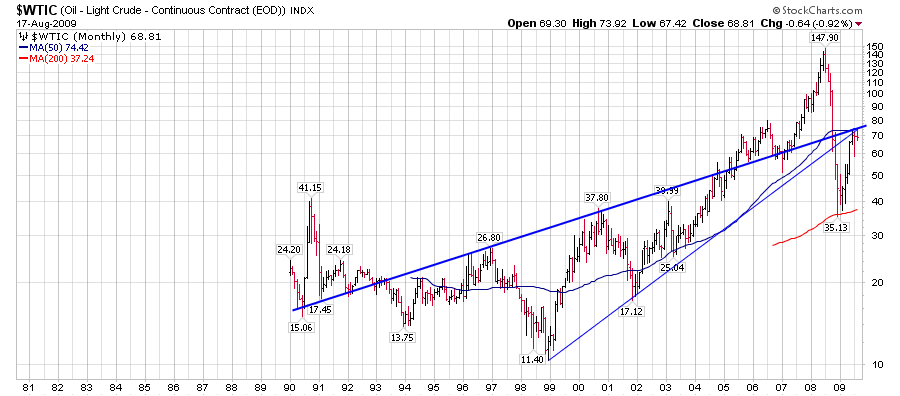
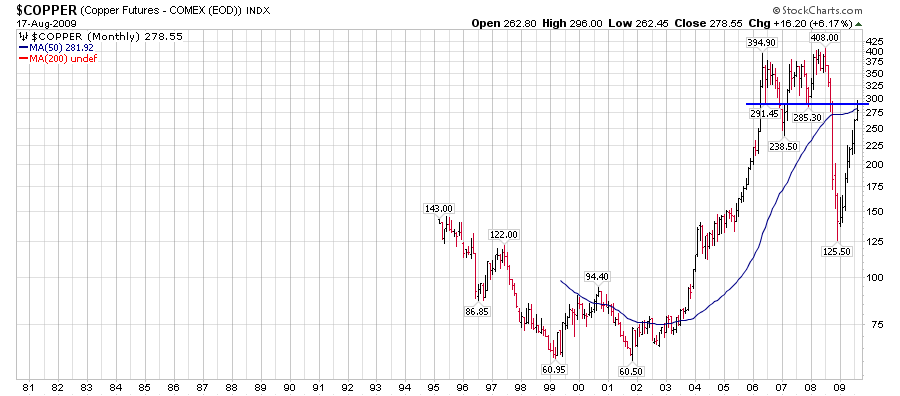
Oil and Copper
I expect that the oil and copper prices will move down with equity prices. This will have an adverse effect on currencies such as AUD. Note that the majority of the larger companies and EFT's associated with oil actually saw their prices peak in early June, so in effect gave an early signal of weakness in the market - as you would expect.
Equity markets
As I have discussed previously, equities appear to be in the terminal stage of an extensive bear market rally - to be reviewed later in an another Charting Perspective.
Daily Charts compared:
Monthly Charts compared:

Till next time.
Garry Abeshouse
Technical Analyst.
Sydney
Australia
I have been practicing Technical Analysis since 1969, learning the hard way during the Australian Mining Boom. I was Head Chartist with Bain & Co, (now Deutsch Bank)in the mid 1970's and am now working freelance. I am currently writing a series of articles for the international "Your Trading Edge" magazine entitled "Market Cycles and Technical Analysis".
I have always specialised in medium to long term market strategies and after discovering the excellent Point & Figure Charts from Stockcharts.com in mid 2008, have concentrated on this style of charting ever since.
© 2009 Copyright Garry Abeshouse - All Rights Reserved
Disclaimer: The above is a matter of opinion provided for general information purposes only and is not intended as investment advice. Information and analysis above are derived from sources and utilising methods believed to be reliable, but we cannot accept responsibility for any losses you may incur as a result of this analysis. Individuals should consult with their personal financial advisors.
© 2005-2022 http://www.MarketOracle.co.uk - The Market Oracle is a FREE Daily Financial Markets Analysis & Forecasting online publication.