


Gold and Crude Oil Rally, A Long Term Look
Commodities / Commodities Trading Oct 25, 2009 - 12:10 PM GMTBy: John_Winston

 When you get right down to it, no matter what techniques one might rely on for his investment decisions there is one thing that they all have in common. In order to be successful an investor has to be on the right side of the longer term trends.
We are all bombarded with daily charts and sometimes weekly, but looking at the long term monthly charts can reveal areas where price on the long term has historically shown to be important turning or continuation points. Not only do they give you a perspective or where price has been in the past, it gives you an idea of where price is now in relation to where major peaks and bottoms occurred.
A great example of how a long term perspective can influence an investment or trading decision can be seen in the Corn chart below courtesy of Moore Research, Inc. http://www.mrci.com/pdf/c.pdf
A quick look at the chart and we can see how the $4.00 area has been a major price turning point in the past. Over the past 38 years, $4 dollars (with the exception of 1996) had been uncharted territory.
Corn CBOT
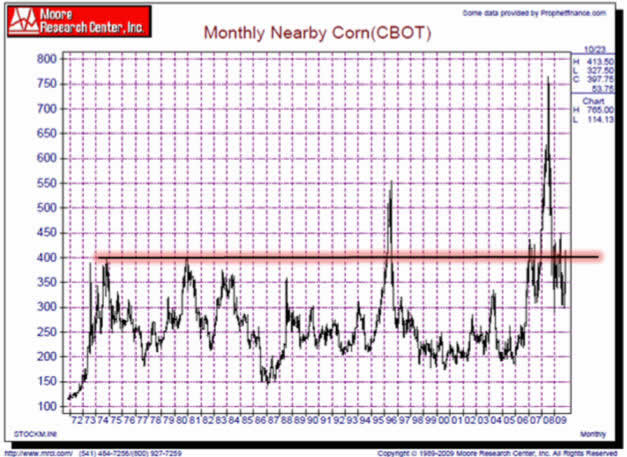
I’ve used this example because it is relevant right now as Corn futures are knocking on the $4 dollar area. But now that we’ve seen a long term chart, we can see how significant this price area is to this commodity. On the inverse, we can see historically that buying Corn at/near/or under $2 dollars a bushel over the past 38 years was buying when price was cheap. Of course it’s not that easy buying 5000 bushels of corn and storing in your basement and trying to re-sell it a few years later. However, I am using corn for illustrative purposes and we will look at the Crude, Natural Gas, and Gold markets after this exercise. Having viewed the chart we can now see how the $4 dollar area is kind of like a pivot point going forward here. Either it’s still a long term price point where corn will turn down or it has the potential to become a floor for long term price. Armed with this knowledge one can at least formulate a decision making process for corn and better understand if the price fundamentals are about to change on a longer term basis.
Now we can also surmise the following after having viewed the monthly corn chart. First, either corn is at or near a potential major peak in price or the long term fundamentals of supply/demand are changing. And there’s a third possibility. The US Dollar’s weakness is affecting the price of corn. To elaborate on the third possibility, it seems that the commodity and financial markets has become a one way street. For the most part, the stock and commodity markets all rally together when the dollar is dropping in value and the opposite when the dollar is rallying. During the latter part of this decade adding currency fluctuation into the analysis is a must.
This history of paper money is littered with great dynasties that have come and gone. Even in the days of Rome, the beginning of the end could be seen in the amount of gold purity that was contained in their coins. Near the end I read somewhere that the gold coins had less than 10% gold and substitutes like bronze was used in the making of the coins.
Over the 20th century little by little the same thing has happened to the currency of the United States. From the confiscation of gold during the great depression, the Bretton Woods agreement to finally Richard Nixon’s removal of the US Dollar from gold, the US Dollar has become nothing more than a piece of paper backed by nothing. On that fateful night Nixon was heard afterward to say “Now……….we are all Keynesians.” About 36 months later the stock market bottomed at 577 and over the next 40 years, would rise to a high of 14,000, gold would move from 35 to 1000 and crude oil from $5 to $150. (At their respective peaks). And that brings us to the world we live in today.
The status of the American dollar from which the term “it’s as good as gold” comes from, has become a currency that has lost the credibility of the global world and while it is not being reported, a mass exodus is underway by the nations who are holding most of it. Its rejection will bring profound changes to the wealth and power that the United States once commanded. The pillars are being removed slowly and while no one has noticed that much, it will be obvious to all when the building finally comes crashing down.
Throughout this global debt crisis, each tool that has been wielded by the Federal Reserve has rendered no results. At first, we were assured that the situation would be remedied, but we have to ask ourselves, what can the Fed do? They have fired all of their bullets already.
Today besides other currencies, the world’s basic substitute for dollars is oil and gold. There is already a move underfoot to no longer price oil in US Dollars, and when that happens, the power of the USA will greatly be usurped.
Since oil and gold play’s such an important part of our financial world and is at the center of headlines, let’s take a look at the long term charts to get a price perspective of where we are at.
First up we have the long term Crude Oil chart. Recall the importance of the $4 dollar area for corn and we can see that Crude Oil has the same long term PIVOT point with the exception that it’s $40 dollars and not $4. We can see how IMPORTANT the $40 dollar area is and we can ask the same questions as we did with Corn.
Crude Oil CBOT - NYM
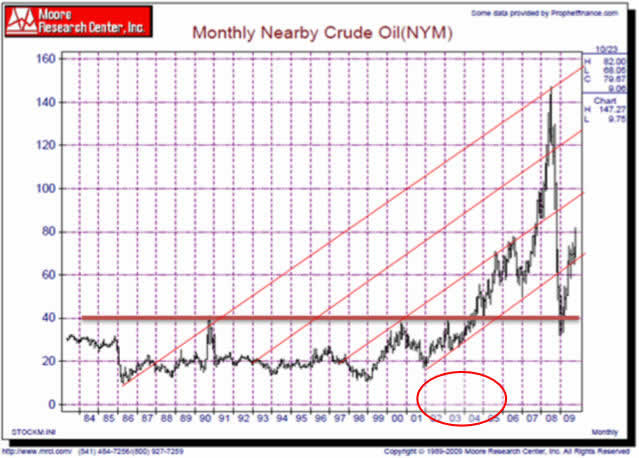
We can see that the 1990 Desert storm spike was right at the 4 dollar area and was a hint of things to come. Forty dollars has an important element to it as well. Recall that we had a mini recession in 1991 about a year after oil had hit $40. Now move over to the year 2000. Notice we had a peak at $40 there as well. Shortly after that, we were in a recession. As a matter of fact, that recession ended not long after the 911 event. Who in USA can’t forget George Bush telling us to all go out and spend money?
We can see that the collapse from the highs near 150 bottomed just below the 40 dollar area and interestingly we’ve been through the deepest recession in 80 years. Now once again oil is moving higher but this time from basically the $40 dollar area. Is $40 the new floor for gold as $20 was during the 80’s and 90’s? Until proven otherwise, we think yes. And if $40 is the new $20, is $80 the new $40? That answer we should have soon as oil is making its second foray into the 80 level with new highs this past week.
The seasonal average for Crude usually peaks in this time frame and it is very possible that Crude could indeed pullback, but it will only do so if the US Dollar bottoms and begins to move up. November is usually the strongest period for the US Dollar as well so it’s an important test. In an average year, we probably would peak here and pullback to the 6o dollar area and form a low sometime in the January/February period.
You will notice that there are three channels that have been added to the price chart. Notice this latest consolidation over the past few months in oil has been bouncing off the bottom of that line at around the 65 dollar area. Then over the past month, we’ve broken out of that range and price has just hurdled $80.
Of particular interest is the second red channel line on the chart. This line goes all the way back to 1997 and if you look at the price action this line has provided resistance to price in 2005 and 2006. Now if we look at the price spike of 2007 we can see that once this second red line was exceeded, we rallied to the 100 area and then to confirm the channel lines importance, price pulled back from 100 right back to the top of that trend line at about $85, and then for about three months price oscillated in that same range as oil bounced back to 100, and one more time down to 85 before liftoff to the 150 area.
Therefore, we can conclude that if the oil market is not peaking here and now and it still has legs, then the most likely price event would be for Crude Oil to climb to the 95-100 area and for price to touch that second red channel line on the chart again.
A final observation is that we can see how the lowest two channel lines have provided the highs and lows for crude oil since 1998 with the exception of the 2007 overshoot oil mania and the 2008 meltdown liquidation event. And since the meltdown low was at the $40 dollar area, we believe that price is now the new floor for oil. In fact, we think that price action will most likely follow between the two red bottom trend lines between now and February. If this is the case, we should expect the highs to be in the 95-105 area and the pullbacks to be in the 68-75 area over the next 3 or 4 months.
This brings us to the currency situation affecting the global marketplace. Up until recently, government debt and printing of money had been done in a somewhat orderly fashion, and for the most part the ravages of inflation were well masked with cheap labor from the developing nations.
But as in the last war (Vietnam) this war was to be no different. Combined with the fact that USA has given its industrial base to China, the latest war on terror has proved to be a deficit killer. The final straw of course was when the real estate market collapsed but the cracks and fissures had long been developing. In fact shortly after the 911 event, when the USA reflated its markets that one final time, the commodity known as gold ended a 20 year bear market and bottomed at the 250 dollar level.
Gold CBOT - CMX
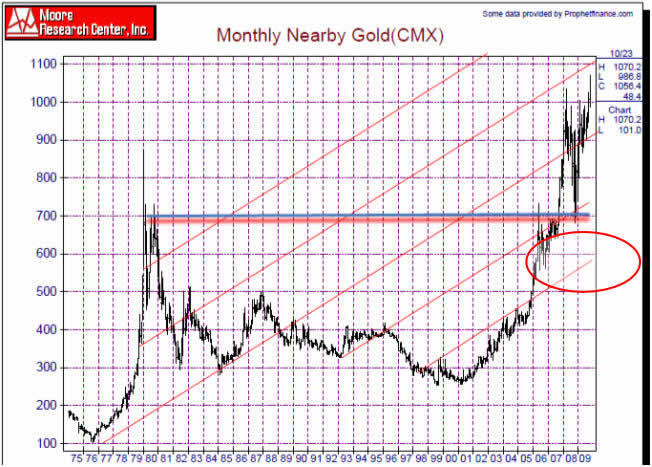
The long term view of Gold shows that as $4 dollars is to corn, and $40 dollars is to gold, the chart above suggests that the $700 dollar area is most probably the PIVOT point for gold. We can see that although 1980 did have a spike to $875, the chart reveals that 700 (or just slightly above it) was where the price rise was really contained. The 2006 high was also at 700 and spent almost a year and a half bouncing off that area before it blasted thru to 1000. Finally, the subsequent 2008 meltdown low was right at the $700 dollar area. We think the weight of the evidence suggests that $700 is indeed the new pivot.
From this chart we can see that gold’s price has been trading in its second channel from the top and like crude’s drop below its channel to its $40 dollar pivot point, gold’s drop during the same meltdown pierced its channel and dropped all the way to $700, its pivot point. The subsequent bounce back into its channel for the past 12 months is now reaching the upper boundary of its channel line. That line is pointing to the 1100 dollar area in the October/November time frame. Like Crude, Gold is also due for a seasonal pullback at this time of the year. Therefore we should be cautious when gold reaches the 1100-1150 area should that price level be realized over the next 2-4 weeks.
Now with that said, the question arises as to whether gold could break above that channel line. Usually channel lines, when broken, are the result of price having tested and bounced off it for a period of time. In this case, while there have been no price hits on this channel, we see that the highs of 2008 were very close to touching that line. And the latest bar on the chart is also very close to touching that channel.
Sometimes there are price spikes that develop at these price points. The 1980 high is one example. But more to the point, 1983 and 2006 witnessed spikes above the red channel line. The potential for gold to do the same on this current rally is a strong possibility as well. The most incredible thing about gold is that it is the only well known commodity to be making NEW HIGHS since the meltdown.
It is an amazing thing that less than 2% of the population own form of gold. In fact, Doug Casey’s work shows that there is only about 1 ounce of the metal available for each person on earth.
That leads to the next question, how much paper money is there on earth? At last look in 2008, it was estimated that there would be about $3000 per person on earth should it be divided up equally. Now there are a lot more complex ways to arrive at what price of gold should be, but even in this simple method it shows that equally speaking, the price of gold should be at least $3000 per ounce.
So what conclusions should we draw from the chart? First, gold is in a major bull market, it is currently the LEADING market of the world making new historic price highs and appreciating at about a 30% clip per year over this decade. We can see that a price high in the 1100 (and possibly 1200 on a spike) could coincide with an autumn pullback that usually develops around this time period along with Crude.
The US Dollar as we have mentioned is the wild card that gets thrown into the mix.
USD - US Dollar
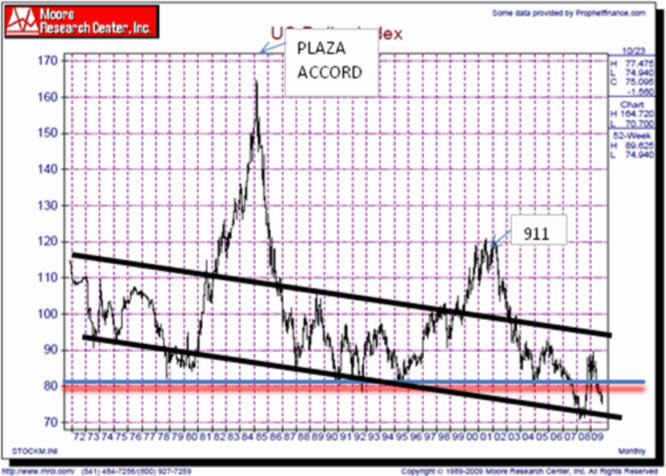
The US Dollar’s pivot point seems to be the 80 area. As you can see, it always provided a support area until interest rates fell to almost zero in order to try and restimulate the US economy over the last few years. Overall however, we can see that the dollar has a down trending channel that it is following long term. We can see that while gold and crude are making their way to the next upper trend line, the US Dollar is making its way to the lower trend line. And this comes at a time when the Dollar enters its usual seasonal rally.
Finally, let’s look at one more chart. Natural Gas.
Natural Gas - NYM
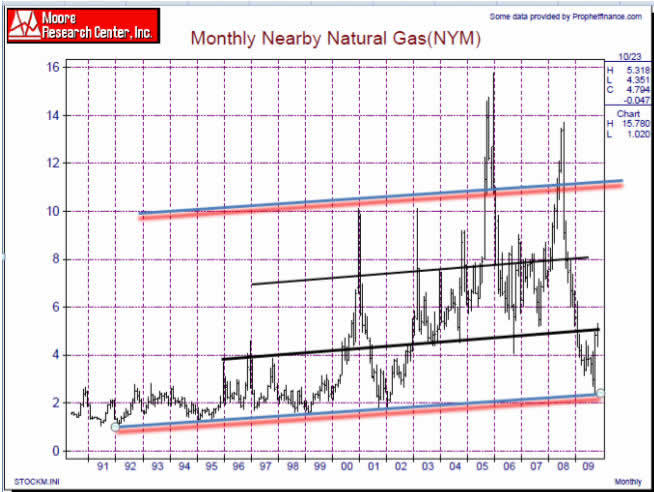
We list this chart because we have recently made a major low in this energy commodity. The recent low near $2 dollars was at the low PIVOT point price. I’ve also highlighted the high PIVOT point on this long term chart, the $10 – $11 dollar area.
During the month of September, Natural Gas made a major low and a spike to the $5 dollar area brings us to the first trend line on the price chart. We see that beyond this area, the $8 dollar area is the next trend line that price projects. For those of you watching the Natural Gas market, think of how more confident you might have been in purchasing a Natural Gas investment had you seen where price was on the long term chart. But if you look closely at the chart, you will see that every time we have ever hit this trend line, price has always BOUNCED off it twice. In 94-95 there was a double bounce. The 98-99 low had a double bounce and finally the 01-02 had a double bounce. If history is any guide, the odds suggest we will get a retest of this area once in 2010 and a long term low will probably be established. Armed with this knowledge, the next time Natural Gas gets anywhere below the $3 dollar level, buy with both arms.
Now that we’ve looked at the long term charts we can draw some probable conclusionsThe Crude Oil market seems to have a new pivot low price of $40 dollars. It is in a price channel that projects the range to be in the 65-100 dollar area. The current rally on the monthly charts projects a rally to the 95-100 dollar area.
The Gold market seems to have a long term pivot price of $700 dollars. It is in a price channel that projects the range to be in the 910-1100 area . The current rally on the monthly charts projects a rally to the 1100-1150 area.
The Natural Gas market seems to have a long term pivot low price of just above the $2 dollar area. It is in a price channel that projects the range to be in the 2-5 dollar area. The current rally on the monthly charts projects a pullback to the pivot line one more time before a long term rally gets underway.
Now that we have the long term price perspectives, we can better focus on our medium and shorter term perspectives. But those timeframes all have their own support and resistance channel lines and their respective up and down trends within these longer term channels. If you have an interest in following the trends of these commodities and getting some advice when great set-ups with low risk entries occur, we invite you to visit our website
If you would like to receive Free Gold Analysis please visit my site: www.TechnicalCommodityTrader.com
By John Winston
John Winston is the technical commodity trader analyst. He provides detailed technical analysis for popular commodities like gold, silver, copper, oil, and natural gas. By focusing strictly on these commodity price movements trading become strictly technical and simple to trade. His free trading reports are available at his website: www.TechnicalCommodityTrader.com
Contact John at: Info [@] TechnicalCommodityTrader.com
© Copyright John Winston 2009
Disclaimer: The above is a matter of opinion provided for general information purposes only and is not intended as investment advice. Information and analysis above are derived from sources and utilising methods believed to be reliable, but we cannot accept responsibility for any losses you may incur as a result of this analysis. Individuals should consult with their personal financial advisors.
© 2005-2022 http://www.MarketOracle.co.uk - The Market Oracle is a FREE Daily Financial Markets Analysis & Forecasting online publication.