UK House Prices Post Annual Gain for First Time in 18 Months
Housing-Market / UK Housing Oct 31, 2009 - 02:11 PM GMTBy: Nationwide
 • House prices rose at a slightly slower pace of 0.4% in October
• Annual house price inflation turns positive for first time since March 2008
• Poor GDP figures have mixed implications for house prices
• Consumer expectations consistent with stable to slightly positive house price inflation
| Headlines | October 2009 | September 2009 |
|---|---|---|
| Monthly index * Q1 '93 = 100 | 322.1 | 320.7 |
| Monthly change* | 0.4% | 0.9% |
| Annual change | 2.0% | 0.0% |
| Average price | £162,038 | £161,816 |
Commenting on the figures Martin Gahbauer, Nationwide's Chief Economist, said:
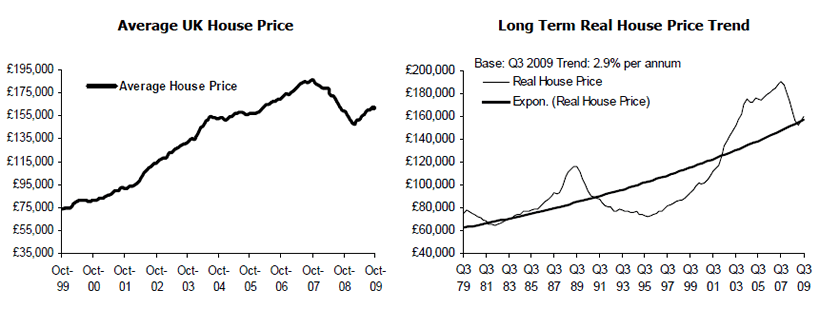
"House prices rose for a sixth consecutive month in October, but the strong upward momentum in property values seen over the summer is showing some signs of moderating as we head into the autumn months. The price of a typical property was 0.4% higher on the month in October, compared to an increase of 0.9% in September and 1.4% in both July and August. The 3 month on 3 month rate of change – generally a smoother indicator of the near term trend – dropped back slightly from 3.8% to 3.4%. At £162,038, the average price of a typical UK property was 2.0% higher than a year earlier, representing the first time since March 2008 that the annual rate of change has been in positive territory. Over the first ten months of 2009, the seasonally adjusted index of house prices has risen by 4.6%, though relative to the October 2007 peak it is still down by 13.1%."
“A moderation in the rate of house price inflation was to be expected, as the very strong monthly increases seen over the summer months were unlikely to be sustainable over the long run. Slower house price inflation is also consistent with developments in housing market activity, as industry figures have shown that the pick-up in mortgage approvals for house purchases has lost some momentum in recent months. Although too early to tell for sure, it may also reflect a more natural level of stock available for sale coming to the market, alleviating some of the extreme shortages of property on the market seen during most of this year.
Poor GDP figures have mixed implications for housing market
“Preliminary GDP figures released by the Office of National Statistics showed that the UK remained in recession during the third quarter of 2009, defying widespread expectations that the economy had begun growing again over the period. The surprisingly poor figures have mixed implications for the housing market. On the one hand, a deeper and longer recession implies higher levels of unemployment and a longer period of subdued wages, both of which will act as constraints on the housing market’s recovery. Given the poor labour market situation implied by the economy’s ongoing weakness, it is difficult to imagine the housing market returning to the buoyant levels of activity and price inflation that prevailed earlier in the decade. On the other hand, the figures mean that interest rates are likely to remain at or near their current record lows for well into next year. As a result, mortgage affordability will remain relatively favourable for both new and existing borrowers. This should limit the number of distressed sales and cushion the negative impact of labour market weakness on housing demand.
Consumer house price expectations have stabilised
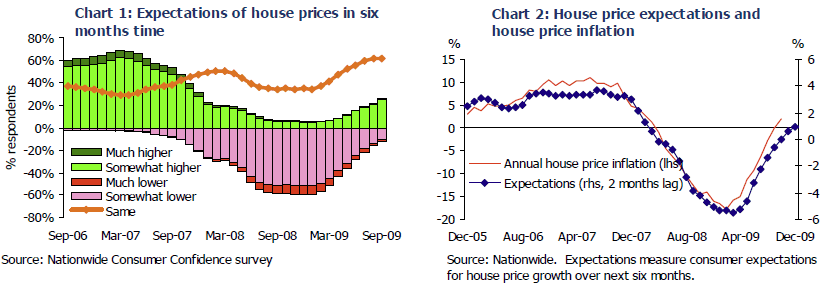
“Notwithstanding the difficult economic situation, over recent months there has been a noticeable shift in consumers’ future house price expectations, as measured by the Nationwide Consumer Confidence survey. House price expectations can often be an important short-term driver of house prices and market activity, as rising price expectations provide an incentive for potential buyers to bring forward their purchases while falling expectations generally lead to purchases being delayed or prices being bid down more aggressively. Indeed, the sharp downturn in house prices experienced during 2008 was preceded by a significant drop in consumer expectations for house price inflation, while the price upturn that began in the spring was preceded by an improvement in expectations.


| Martin Gahbauer Chief Economist Tel: 01793 655434 fionnuala.earley@nationwide.co.uk |
Roy Beale Media Relations Officer Tel: 01793 655689 roy.beale@nationwide.co.uk |
Notes: Indices and average prices are produced using Nationwide's updated mix adjusted House Price Methodology which was introduced with effect from the first quarter of 1995. Price indices are seasonally adjusted using the US Bureau of the Census X12 method. Currently the calculations are based on a monthly data series starting from January 1991. Figures are recalculated each month which may result in revisions to historical data. The Nationwide Monthly House Price Index is prepared from information which we believe is collated with care, but no representation is made as to its accuracy or completeness. We reserve the right to vary our methodology and to edit or discontinue the whole or any part of the Index at any time, for regulatory or other reasons. Persons seeking to place reliance on the Index for their own or third party commercial purposes do so entirely at their own risk. All changes are nominal and do not allow for inflation. More information on the house price index methodology along with time series data and archives of housing research can be found at www.nationwide.co.uk/hpi
Nationwide Archive |
© 2005-2022 http://www.MarketOracle.co.uk - The Market Oracle is a FREE Daily Financial Markets Analysis & Forecasting online publication.


