


Bucking Bronco Stock Market Rising With Few Bulls
Stock-Markets / Financial Markets 2009 Nov 07, 2009 - 06:59 PM GMT

 We now have the highest
jobless rate since 1983 - The unemployment rate in the U.S. soared to a 26-year high of 10.2 percent in October and employers cut more jobs than forecast, underscoring why Federal Reserve policy makers say interest rates will remain near zero.
We now have the highest
jobless rate since 1983 - The unemployment rate in the U.S. soared to a 26-year high of 10.2 percent in October and employers cut more jobs than forecast, underscoring why Federal Reserve policy makers say interest rates will remain near zero.
Payrolls fell by 190,000 workers last month, compared with a 175,000 drop anticipated by the median forecast of economists surveyed by Bloomberg News, figures from the Labor Department showed today in Washington. The jobless rate gained from 9.8 percent in September and exceeded 10 percent for the first time since 1983.
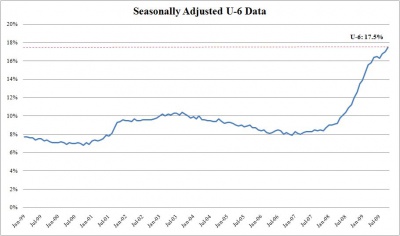 Under the alternative measures of Labor underutilization, Line U-6 gives us, “Total unemployed, plus all marginally attached workers, plus total employed part time economic reasons, as a percent of the civilian labor force plus all marginally attached workers…” up to 17.5% from 17% in the prior month. (See the chart above)
Finally, the CES Birth/Death Model added 86,000 hypothetical jobs to the payroll data to make things look “less bad.” Could the real unemployment number have been 276,000 lost jobs? Will we ever know?
Is the market acting like a bucking bronco?
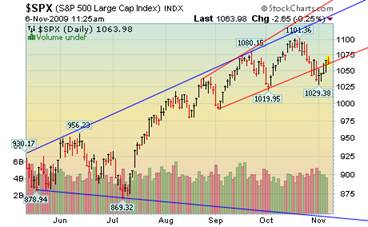 --Just as a rodeo bronco attempts to buck everyone off of its back, the stock market likes to rise with as few investors as possible on board. And it's doing one heck of a job: The stock market is back to within shouting distance of where it stood on Oct. 19, its previous rally high, and yet there are far fewer bulls today than then. Read more in Chris Martenson’s blog below.
There’s a telltale pattern in Treasuries.
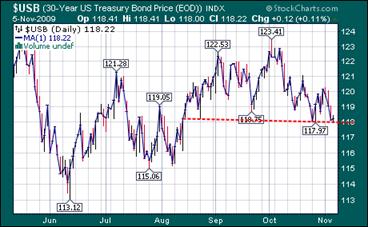 Treasuries are presenting us with a complex head and shoulders pattern that cannot be ignored. Should they drop below 118, the potential target for the decline to follow will take bonds below the June low.Treasury two-year note yields fell to a month low after the U.S. unemployment rate rose to a 26-year high of 10.2 percent, reinforcing expectations the Federal Reserve will keep rates low for an extended period. But those are short-term rates!
Gold tops $1,100…for how long?
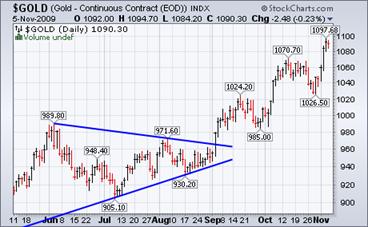 --Gold futures jumped to a record, topping $1,100 an ounce, on mounting speculation that low U.S. borrowing costs will drive the dollar lower, boosting the appeal of the precious metal as an alternative investment. The metal reached $1,101.90 in New York, heading for a ninth straight annual gain. The dollar is down 6.9 percent this year against a basket of six major currencies as the Federal Reserve keeps its benchmark interest rate at zero to 0.25 percent to revive economic growth.
Is the Nikkei heading for more sell-offs?
 -- Japanese stocks fell, led by financial companies on concern stricter rules will force them to raise funds, diluting the value of current shareholdings, and after companies cut their profit forecasts. “Regulations are expected to be tightened, so financial companies have to raise capital to maintain their size,” said Kiyoshi Ishigane, strategist at Mitsubishi UFJ Asset Management Co. “An excess supply of their shares will lead to sell-offs.”
Can China keep up the torrid pace? 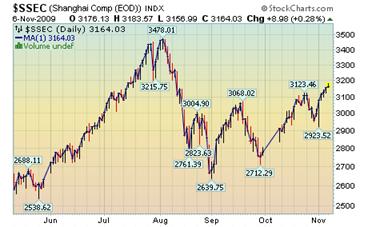
-- China’s stocks rose, sending the Shanghai Composite Index to its biggest weekly gain in more than three months, on speculation the government will extend stimulus measures to cement the economic recovery. The benchmark index rose 8.98, or 0.3 percent, to 3,164.04 at the close, gaining for a sixth day. The gauge has surged 5.6 percent this week, the most since the period to July 24, as manufacturing expanded at the fastest pace in 18 months.
The dollar may be retesting its low.
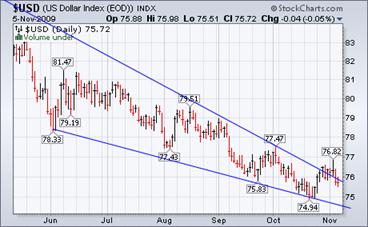 The dollar headed for a weekly loss against the euro before a government report today forecast to show U.S. employers cut fewer jobs last month, boosting demand for higher-yielding assets. “The Federal Reserve won’t be able to implement exit strategies until the jobless rate improves,” said Yoshihiro Nomura, Tokyo-based foreign exchange team manager at Trust & Custody Services Bank Ltd. “They may start raising interest rates near the end of next year. The Fed will be among the last to exit, and dollar weakening will continue for a while.”
Lenders have no economic incentive to deal honestly.
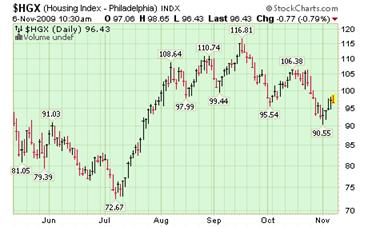 --"Given these economic incentives for the lender, a seriously under-water homeowner with good credit and solid mortgage payment history who responsibly calls his lender to work out a loan modification is likely to be told by his lender that it will not discuss a loan modification until the homeowner is 30 days or more delinquent on his mortgage payment. The lender is making a bet (and a good one) that the homeowner values his credit score too much to miss a payment and will just give up the idea of a loan modification...” (Thanks, Mish!)
Gasoline prices still high. 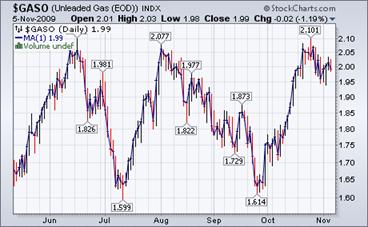
The Energy Information Agency weekly report suggests, “The U.S. average retail price for regular gasoline gained 2 cents this week to reach $2.694 per gallon, the highest level this year. This surpassed the previous 2009 weekly high of $2.691 per gallon seen on June 22. The national average is now $0.29 per gallon higher than it was a year ago. Prices increased in all regions of the country.”
Weather may affect natural gas prices for a season.
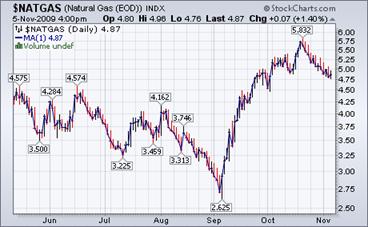 The Energy Information Agency’s Natural Gas Weekly Update reports, “Natural gas spot prices fell over the week at most market locations, declining on average 16 cents per million Btu (MMBtu). Decreases ranged between 2 cents and 77 cents per MMBtu. In the few trading locations where prices rose, increases were modest, ranging between 1 and 4 cents per MMBtu.
Working natural gas in storage increased to 3,788 billion cubic feet (Bcf) as of October 30, according to EIA’s Weekly Natural Gas Storage Report. This figure represents an implied net injection of 29 Bcf. Storage levels reached new record highs in all three storage regions, as well as on a national level.”
Chris Martenson details a “most perplexing moment” in wealth preservation.
After digging around and sifting through the things both said and not said, I have come to the conclusion that what we are seeing are the likely effects of a rescue operation.
By this I mean a large injection of stabilizing cash to one or more parties, possibly related to the recent large bankruptcies. Two of my friends, who have been actively trading for more than 20 years between them, threw in the towel this week, as their patterns and methods are no longer working.
Their conclusion is the same as mine; this market is not trading like it used to. It is trading chaotically, counterintuitively, and as if there's some sort of distorting influence involved.
First, we might just wonder if this isn't the impact of a rogue firm with entirely too much power moving the market for its own benefit. You’ve hit the nail on the head, Chris!
On November 6, 1930… Market wrap: “Whole market under pressure most of the session; “results of the election were undoubtedly the principal factor”; as additional results became known and it became clear Democratic gains were larger than expected, liquidation increased; commodities also came under severe pressure. Leaders including AT&T, Westinghouse and Standard Gas hit new 1930 lows; selling spread to rails; US Steel broke to lowest point since 1928 on further decline in production. Volume was not heavy and decline orderly but steady; activity increased in final hour when new lows were established.”
Our Investment Advisor Registration is on the Web
We are in the process of updating our website at www.thepracticalinvestor.com to have more information on our services. Log on and click on Advisor Registration to get more details.
If you are a client or wish to become one, please make an appointment to discuss our investment strategies by calling Connie or Tony at (517) 699-1554, ext 10 or 11. Or e-mail us at tpi@thepracticalinvestor.com .
Anthony M. Cherniawski,
President and CIO
http://www.thepracticalinvestor.com
As a State Registered Investment Advisor, The Practical Investor (TPI) manages private client investment portfolios using a proprietary investment strategy created by Chief Investment Officer Tony Cherniawski. Throughout 2000-01, when many investors felt the pain of double digit market losses, TPI successfully navigated the choppy investment waters, creating a profit for our private investment clients. With a focus on preserving assets and capitalizing on opportunities, TPI clients benefited greatly from the TPI strategies, allowing them to stay on track with their life goals
Disclaimer: The content in this article is written for educational and informational purposes only. There is no offer or recommendation to buy or sell any security and no information contained here should be interpreted or construed as investment advice. Do you own due diligence as the information in this article is the opinion of Anthony M. Cherniawski and subject to change without notice.
Anthony M. Cherniawski Archive |
© 2005-2022 http://www.MarketOracle.co.uk - The Market Oracle is a FREE Daily Financial Markets Analysis & Forecasting online publication.