Stock Market Cycle Target Met, Indexes Short Term Toppy
Stock-Markets /
Cycles Analysis
Dec 31, 2009 - 08:14 AM GMT
By: Jim_Curry


In my prior article (December 2, 2009) I noted that the low that was registered in early-November was the confirmed bottom for each of the 45, 90 and 180-day cycles on the SPX. With that came along the expectation that the various US stock indexes would continue to see higher highs into at January of 2010 or later.
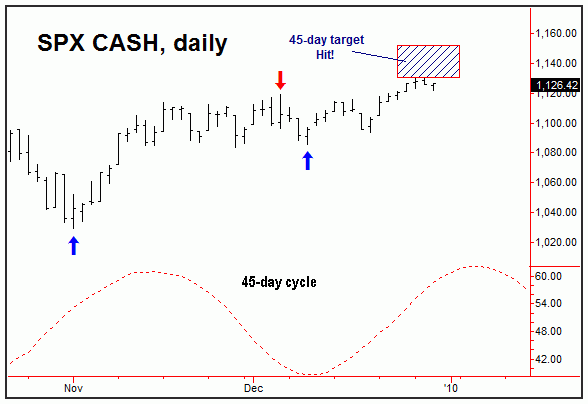
In terms of price, back in November the 45-day cycle had confirmed an upside cyclic target to the 1130.09 - 1153.63 level for the SPX, which has now been satisfied with the recent action:

Having said that, the December 9th low ended up being confirmed as a contracted bottom for this cycle - which is starting to shrink in length - and is currently averaging closer to 38 trading days from trough to trough.
In looking at a statistical analysis of this 45-day cycle, when it registers the pattern of a 'higher-low' - which it had to have done at the December 9th bottom - then the average rally over the past decade has normally been in the range of 25 trading days from trough to peak. If this proves correct for the current upward phase, then the inference is that the SPX won't see it's next peak with this cycle forming prior to January 15, 2010 - but could obviously come anywhere past this point. This statistical inference will remain intact as long as the December 9 low of 1085 holds any near-term downside.
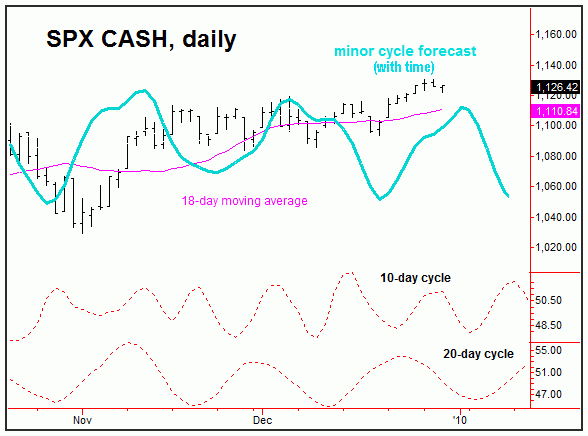
Even with the above, the short-term cycles are looking a bit toppy at the present time - ideally looking at a peak anytime between now and very early next week. The chart below shows both the 10 and 20-day cycles, which are going over a top - and are due for a combination bottom in the January 6 - 11, 2010 time zone. Short-term resistance is at or into the 1135-1143 range for the SPX, and could be an area to look for these cycles to attempt to peak:

Once the 10 and 20-day cycles do top out, then a short correction should be seen, one that would ideally see prices retracing back to or below the 18-day moving average into the first week or so of January. However, as along as the next 20-day bottom holds at or above the 1085 level (which is the last low for this component, as well as for the 45-day cycle), then the probabilities will favor a continued push to higher highs into mid-to-late January of 2010 - then potentially setting up a more important peak with each of the larger 45-day and 90-day cycles.
For the bigger picture, getting a look ahead into the first quarter of 2010, the cyclical patterns with the mid-term cycles are leaning in favor of a mid-January or early-February high, then to be followed by a sharp drop into the next 90-day bottom. This cycle is tentatively scheduled to low-out around mid-March, but does have a plus or minus variance of several weeks in either direction. We'll take a look at the larger cycles at some point again in a future article
By Jim Curry
Market Turns Advisory
email: jcurry@cycle-wave.com
website: http://cyclewave.homestead.com
Jim Curry is the editor and publisher of Market Turns advisory, which specializes in using cyclical analysis to time the markets. To be added to our mailing list click HERE
Disclaimer - The financial markets are risky. Investing is risky. Past performance does not guarantee future performance. The foregoing has been prepared solely
for informational purposes and is not a solicitation, or an offer to buy or sell any security. Opinions are based on historical research and data believed reliable,
but there is no guarantee that future results will be profitable. The methods used to form opinions are highly probable and as you follow them for some time you
can gain confidence in them. The market can and will do the unexpected, use the sell stops provided to assist in risk avoidance. Not responsible for errors or
omissions. Copyright 1998-2007, Jim Curry
© 2005-2022 http://www.MarketOracle.co.uk - The Market Oracle is a FREE Daily Financial Markets Analysis & Forecasting online publication.


