


How to Trade Gold and other Commodity ETF’s
Commodities / Commodities Trading Jan 17, 2010 - 04:32 PM GMTBy: Chris_Vermeulen

 Whether you are trading stocks, ETFs or futures, technical analysis is the preferred choice for short term traders. Technical analysis in short is the study of price and volume movements on charts. It can be used for studying charts in any time frame whether you are a 1 minute chartist or a long term investor using monthly charts.
Using technical analysis in my opinion really opens the door for a trader to lower his/her overall risk when investing money. I always like to know if the investments I am watching are trading near a critical price level (support or resistance). During these times you can take positions that have very clear entry and exit points for trading. Also it puts the odds in your favor when a position is entered in the same direction of the underlying trend.
Price action is how we make money in the market, so I strictly follow price and volume when trading as they are the least lagging indicator on what the market it doing.
I have put together a few charts using commodity ETFs to show you what I am seeing in the market and what we should expect to see in the coming days.
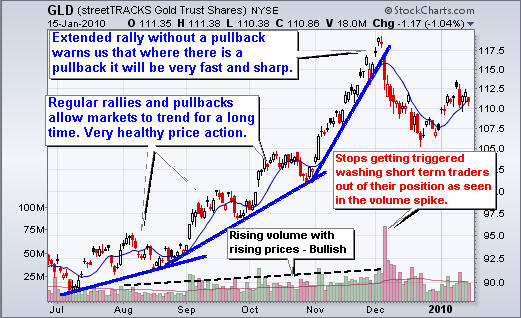
GLD ETF Trader – Daily Trend Chart
The gold trading chart below shows two different types of trends. The initial timeframe of the chart illustrates what I call a Normal Trend. This is a series of higher highs and lows.
This type of trend allows an investment to continue profitably for a very long period of time. For example a daily chart like the one below can continue to trend like this for 6-8 months. The reason for this is because price appreciation is increasing at a rate which investors are comfortable with. Also, the pullbacks cleanse the investment vehicle of weak traders every few weeks allowing fresh money to enter at higher price.
Now if you look at the later timeframe of this rally we observe a rally phase I call an Extended Rally. An extended rally is when price appreciates without any pullbacks.
You can make a fortune with this trend very quickly, but you must realize that reversals are fast and sharp. And that, we observe, is how GLD performed in December. While some call December’s price drop a pullback, I call it a technical breakdown. The sharp price reversal and heavy volume associated with this type of move generally provides excellent short term momentum trades. A lot of damage is done to the investment on a heavy volume breakdown taking weeks for a recovering to occur.
Normal trend rally, extended rally, predictably fast and sharp technical breakdown followed by weeks of recovery.
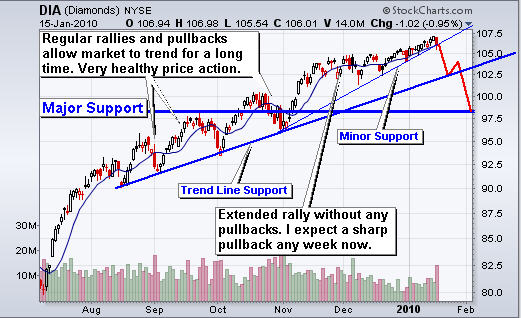
DIA Exchange Traded Fund – Daily Trend Trading
The DIA exchange traded fund shows a very similar chart as gold above. First we have a nice Normal Trend that then evolved into an Extended Trend. The trend for the DIA index fund is not nearly as steep at the gold chart, so it could trend a little longer. But once the price breaks down, everyone is going to be selling out to lock in gains and cut losses before new positions are entered.
I have several tools and stats I use for helping me in timing turning points. Some are great short term indicators only predicting 1-2 days out like following small cap stocks, or gold stocks in relation to the broad index, and others are long term things like cycles, volume analysis, market internals and the volatility index.
My point here is to keep everyone alert and ready to take profits if we see things start to roll over. Friday there was BIG selling volume across the board – so don’t blink now.
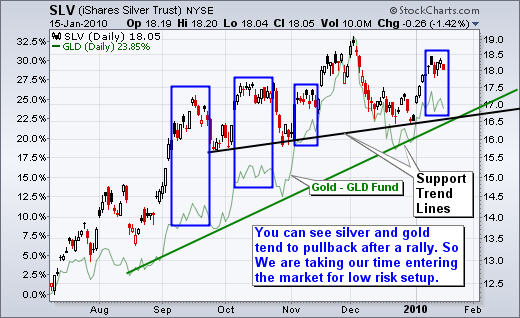
Silver & Gold ETF Trading – Daily Charts
Below is the chart of the silver ETF SLV and I overlaid the GLD gold fund in green so you can see how they move in sync. The blue boxes on the chart show the pattern that I think is forming and what to expect in the coming days.
From looking at gold in both other currencies and with respect to gold stocks which have been underperforming, I feel we are going to see lower prices still. At the moment I am neutral on silver and gold for the short term time frame (daily & 60 minute charts).
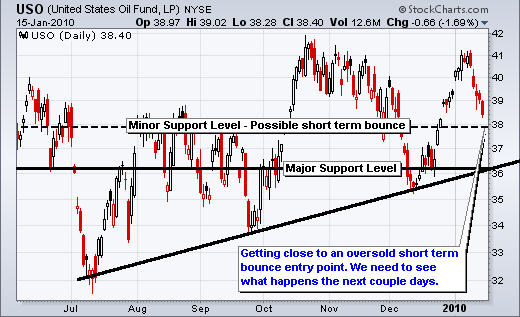
USO Crude Oil Fund – Daily Trend Chart
Oil has slid lower the past 5 sessions and is now nearing a support level. This has me looking for an oversold bounce with the potential to rally much higher. I am keeping an eye on this for any possible low risk setup.
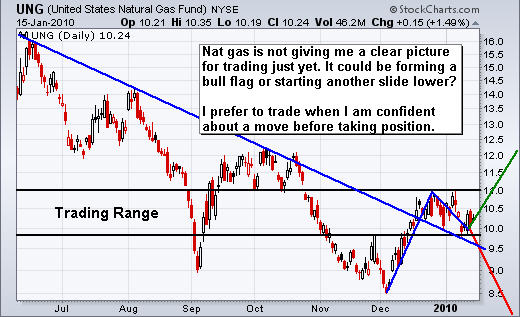
UNG Natural Gas Fund – Daily Trading Chart
While UNG is not a great intermediate and long term fund to invest in, I do find it trades very nicely for intraday and short swing trades. I am neutral on natural gas for the time being. It could go either way from here and I’m not willing to take on a 50/50 probability trade. Let’s wait for something exciting to form.
Commodity Trading Conclusion:
In short, gold and silver have been underperforming the market recently which is not what we want to see. They have led the market higher all year but are now taking a breather.
The way I see gold, silver, oil and natural gas is that they are trading below their recent highs and still have more room to fall before landing on a solid support level.
The stock market is now over extended and looks ready for a sharp correction. If this happens we will see commodities drop and test lower prices also.
There is not much we can do right now other than protect our current long positions by tightening our stops. Depending on the strength of the breakdown, there could be a great opportunity for short term traders (60 minute chart traders) to make some quick money. I expect a sell off which will last 3-5 days at the least.
To Your Financial Success,
By Chris Vermeulen
Chris@TheGoldAndOilGuy.com
Please visit my website for more information. http://www.TheGoldAndOilGuy.com
Chris Vermeulen is Founder of the popular trading site TheGoldAndOilGuy.com. There he shares his highly successful, low-risk trading method. For 6 years Chris has been a leader in teaching others to skillfully trade in gold, oil, and silver in both bull and bear markets. Subscribers to his service depend on Chris' uniquely consistent investment opportunities that carry exceptionally low risk and high return.
This article is intended solely for information purposes. The opinions are those of the author only. Please conduct further research and consult your financial advisor before making any investment/trading decision. No responsibility can be accepted for losses that may result as a consequence of trading on the basis of this analysis.
Chris Vermeulen Archive |
© 2005-2022 http://www.MarketOracle.co.uk - The Market Oracle is a FREE Daily Financial Markets Analysis & Forecasting online publication.