Bristol-Myers Squibb Company BMY Thrust Off Neckline
Companies / Company Chart Analysis Mar 05, 2010 - 04:49 PM GMTBy: Mike_Paulenoff
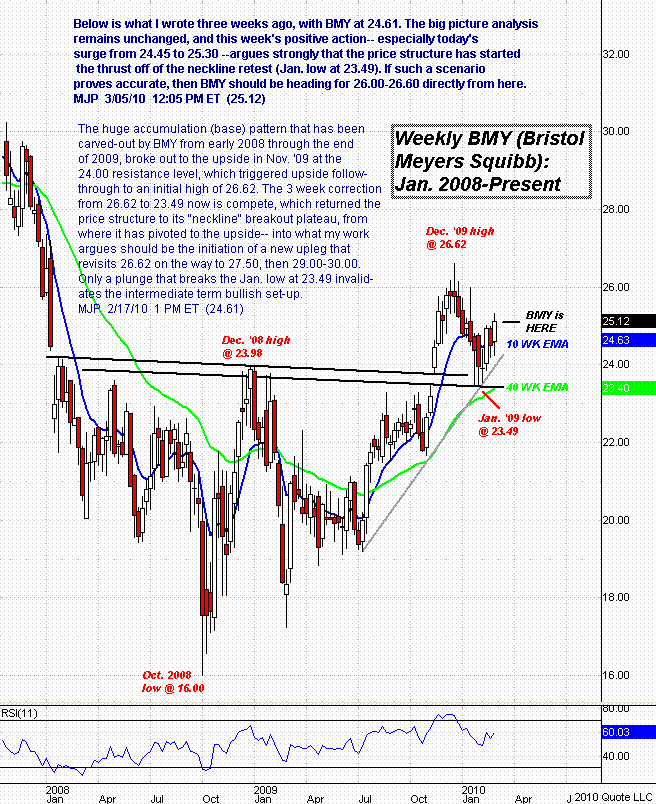
Bristol-Myers Squibb Company (BMY) continues to act extremely well technically. Below is what I wrote three weeks ago, with BMY at 24.61. The big picture analysis remains unchanged, and this week's positive action -- especially today's surge from 24.45 to 25.30 -- argues strongly that the price structure has started the thrust off of the neckline retest (Jan low at 23.49). If such a scenario proves accurate, then BMY should be heading for 26.00-26.60 directly from here.
From our Feb 17 analysis: The huge accumulation (base) pattern that has been carved-out by BMY from early 2008 through the end of 2009, broke out to the upside in Nov. '09 at the 24.00 resistance level, which triggered upside follow- through to an initial high of 26.62. The 3 week correction from 26.62 to 23.49 now is compete, which returned the price structure to its "neckline" breakout plateau, from where it has pivoted to the upside-- into what my work argues should be the initiation of a new upleg that revisits 26.62 on the way to 27.50, then 29.00-30.00. Only a plunge that breaks the Jan. low at 23.49 invalidates the intermediate term bullish set-up.

Sign up for a free 15-day trial to Mike's ETF & Stock Trading Diary today.
By Mike Paulenoff
Mike Paulenoff is author of MPTrader.com (www.mptrader.com), a real-time diary of his technical analysis and trading alerts on ETFs covering metals, energy, equity indices, currencies, Treasuries, and specific industries and international regions.
© 2002-2010 MPTrader.com, an AdviceTrade publication. All rights reserved. Any publication, distribution, retransmission or reproduction of information or data contained on this Web site without written consent from MPTrader is prohibited. See our disclaimer.
Mike Paulenoff Archive |
© 2005-2022 http://www.MarketOracle.co.uk - The Market Oracle is a FREE Daily Financial Markets Analysis & Forecasting online publication.


