


Weekly Commodity Analysis for Gold, Silver, Crude Oil and Natural Gas
Commodities / Commodities Trading Mar 21, 2010 - 04:36 PM GMTBy: Chris_Vermeulen

 Last week was nothing special as stock market continued to drift higher on light volume and the Volatility Index (VIX) reaching a new multi year low. This mix of higher prices on light volume, multi year lows in the VIX and an overbought market paints a clear picture to a market technician – Be Ready for a Pullback!
Last Wednesday I sent out a report covering sector rotation comparing the price performance of these sectors from the January peak with last weeks price action. It was very interesting and it pointed to a sharp sell off Thursday or Friday
Here is last Wednesday’s report if you are interested:http://www.marketoracle.co.uk/Article17975.html
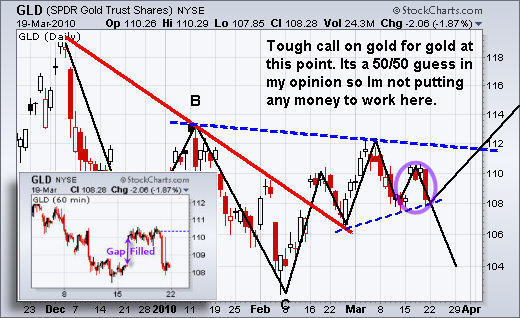
GLD Gold ETF Daily & 60 Minute Chart
Last week gold gap higher then traded sideways for a few days. I will admit it was very tempting to buy into the move but I stuck with my trading strategy which is to not chase moves which gap in my direction.
Gaps are known to get filled about 70% of the time. What that means in this situation is that the price will most likely sell back down to fill that gap before trying to move higher.
All that said the problem I see now on the daily chart is the possibility of the mini Head & Shoulders pattern breaking down. If gold moves any lower then I would expect a sharp pullback. The measured move would equal a pullback to the $104 area on the GLD chart and the $1070 level for spot gold.
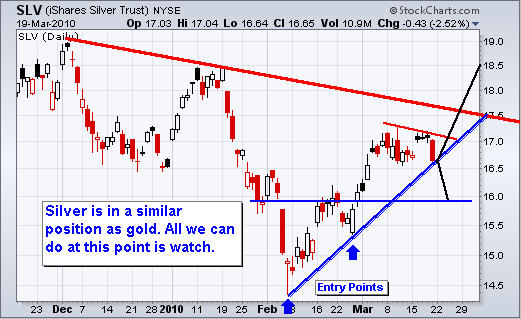
SLV Silver ETF Trading Chart
The silver chart looks much different than gold’s but in reality they are trading in a similar situation. If silver moves any lower then sellers will flood the market and take the price down to the next support level. But if we get a bounce then it should surge and rally almost a $1 per ounce from this point.
Only time will tell as we let this trade unfold with a stop at $16.52.
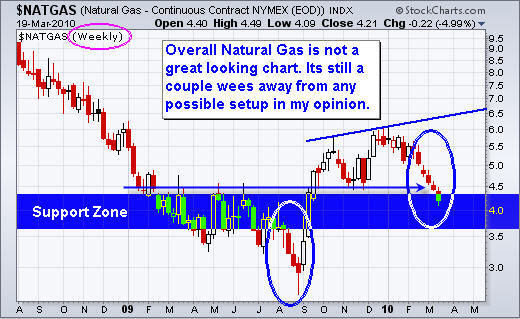
Natural Gas – Weekly Trading Chart
Natural gas has been selling down for almost 2 months. The chart is starting to show a possible buy point if all goes well in the next few weeks.
What I like about this chart is that we saw a break of a support level and heavy selling which tells me the general herd is getting shaken of their long positions. This extended sell off is now entering a support zone and could provide us with a low risk setup in the next 2-3 weeks.
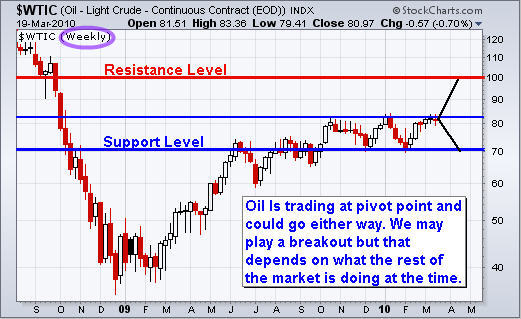
Crude Oil – Weekly Trading Chart
Oil is trading similar to gold and silver. It is trading at a key pivot point and could go either way quickly. I will be keeping my eye on the daily and 60 minute charts for a possible low risk entry point.
Weekend Stock & Commodity Trading Conclusion:
In short, the overall market is trading at level were there is not much to we can do. Day traders are able to take advantage of this price action but not swing traders.
I feel the major indexes have another 1-2 down day left in them before a bounce, but it’s more difficult to gauge the momentum with a cool down period in the middle of it all (the weekend).
The market is on the edge of some exciting moves as I can feel something brewing. With any luck there could be some great opportunities in the coming days.
If you would like to receive my free weekly trading reports please visit at: TheGoldAndOilGuy
Hello, I'm Chris Vermeulen founder of TheGoldAndOilGuy and NOW is YOUR Opportunity to start trading GOLD, SILVER & OIL for BIG PROFITS. Let me help you get started.
To Your Financial Success,
By Chris Vermeulen
Chris@TheGoldAndOilGuy.com
Please visit my website for more information. http://www.TheGoldAndOilGuy.com
Chris Vermeulen is Founder of the popular trading site TheGoldAndOilGuy.com. There he shares his highly successful, low-risk trading method. For 6 years Chris has been a leader in teaching others to skillfully trade in gold, oil, and silver in both bull and bear markets. Subscribers to his service depend on Chris' uniquely consistent investment opportunities that carry exceptionally low risk and high return.
This article is intended solely for information purposes. The opinions are those of the author only. Please conduct further research and consult your financial advisor before making any investment/trading decision. No responsibility can be accepted for losses that may result as a consequence of trading on the basis of this analysis.
Chris Vermeulen Archive |
© 2005-2022 http://www.MarketOracle.co.uk - The Market Oracle is a FREE Daily Financial Markets Analysis & Forecasting online publication.