


Breaking Down the Major China ETFs, FXI, PGI and HAO
Stock-Markets / China Stocks Apr 19, 2010 - 11:50 AM GMTBy: Justice_Litle


![]() China is a big story, with many moving parts. But these three ETFs can help you keep tabs on the dragon.
China is a big story, with many moving parts. But these three ETFs can help you keep tabs on the dragon.
So let’s say, as a trader or an investor, you want to get involved in the China story. How do you do it?
There are many different ways into China. Some are direct, and some are indirect. For example, there are a number of Chinese companies publicly listed on Western exchanges. These companies focus on a wide variety of opportunities, both domestic and foreign (inside the country and out).
Then, of course, there are the countless investment plays that feel a heavy influence from China. In Australia, for example, a number of new billionaires have been minted in the outback, thanks to China’s strong demand for Aussie metals in the ground.
China’s influence even pushes into areas you might not expect, like consumer retail. Crocs (CROX:NASDAQ) and Coach (COH:NYSE), two high-flying names of the moment, are known for the expensive baubles they sell to Westerners. Both are now red hot, at least in part, due to runaway optimism over the prospect of domestic China sales. (Bubble, bubble, toil and trouble…)
Today we’ll keep it simple by looking at three major China ETFs (exchange-traded funds). There are others, but these three are liquid, shortable and at the top of the heap:
• The FTSE / Xinhua China 25 ETF (FXI:NYSE) • The PowerShares Golden Dragon Halter USX ETF (PGJ:NYSE) • The Claymore / AlphaShares China Small Cap Index ETF (HAO:NYSE)
The FTSE / Xinhua China 25 ETF (FXI)
The biggest of the three is the FTSE / Xinhua China 25 ETF, or FXI. Here is the official description of FXI:
Investors globally use the FTSE/Xinhua China 25 Index to gain exposure to the Chinese markets. The index consists [sic] 25 of the largest and most liquid Chinese stocks (Red Chips and H shares) listed and trading on the Stock Exchange of Hong Kong (SEHK). The index is specifically designed for international investors, combining the ease of trading on the Hong Kong exchange with a methodology to meet fund regulatory requirements worldwide.
You might say FXI is like the Dow Jones of China. Instead of 30 “blue chips,” though, you get 25 “red chips” (reflecting China’s communist heritage).
FXI has average volume of more than 25 million shares per day, according to data from The Wall Street Journal. So it is very liquid. But there is another key thing to be aware of with the China 25 ETF: It’s dominated by financials.
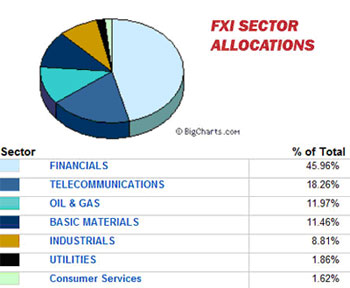
The above chart, from the WSJ and BigCharts.com, tells the story. Nearly 46% of FXI – almost half of the pie – is weighted toward financial names. FXI is heavy on banks and insurance companies, including names like China Life Insurance Co., Bank of China and China Construction Bank.
This heavy financial weighting makes FXI an interesting short candidate. (Not just now, but when the time is right.) Why? Because one of the big drivers of the Chinese investment boom has been the “forced lending” dynamic.
China is still very much a command economy, and so when Beijing says “lend,” the bankers say “how much.” In the past 12 months, Chinese banks have lent out absolutely insane amounts, on Beijing’s orders, with minimal consideration for repayment risk.
Thanks to an out-of-control extension of credit, the situation is not unlike America’s before the housing bubble popped – or possibly even worse. China’s banks have a huge backlog of NPLs (non-performing loans) built up, and noted short seller Jim Chanos sees the situation as “Dubai times a thousand.” (We’ll talk more about this angle later on.)
The PowerShares Golden Dragon Halter USX China ETF (PGJ)
The PowerShares Golden Dragon Halter USX China ETF, or PGJ, looks very different. For one thing, PGJ has a less-than-8% weighting toward financial names. That’s a big drop compared to FXI.
The focus of PGJ is very different too. Whereas FXI is like the Dow of China, representing 25 “red chip” names, PGJ is built to track the performance of the Halter USX China Index. Here is the official description:
The Halter USX China Index… is comprised of companies whose common stock is publicly traded in the United States and the majority of whose business is conducted within the People's Republic of China.
For a company to be included in the Halter USX China Index it must have an average market capitalization of more than $50 million for the preceding 40 days, trade on the NYSE or Nasdaq and must be approved by our Selection Committee.
So now we see that, while FXI contains names traded on the Hong Kong Stock Exchange, all the companies in the PGJ basket are listed on a major U.S. exchange. ![]()
| PGJ Top 10 Holdings | |
| Company Name | % of Total Portfolio |
| CHINA MOBILE | 8.28% |
| PETROCHINA CO LTD | 7.03% |
| CHINA LIFE INSURANCE CO LTD | 5.79% |
| BAIDU INC | 5.65% |
| CHINA TELECOM CORP LTD | 4.87% |
| CNOOC LTD | 4.67% |
| YANZHOU COAL MINING CO LTD | 4.51% |
| CHINA UNICOM (HONG KONG) LTD | 4.34% |
| SINOPEC CORP | 4.14% |
| ALUMINUM CORPORATION OF CHINA LTD | 4.07% |
| Total: | 53.35% |
![]() Source: WSJ
Source: WSJ
The top 10 holdings of PGJ, as shown above, make up more than half the weighting. You can get a full list of all the names – and there are plenty of them – from the Halter USX China Index Web site. That list is also a potentially good starting point for deeper digging into individual China equity plays.
PGJ isn’t nearly as liquid as FXI. It does average volume of just above 143,000 shares, according to WSJ data. But that’s still plenty tradable.
The Claymore / AlphaShares China Small Cap ETF (HAO)
Last but not least, there is the China Small Cap ETF, or HAO.
In Mandarin, “ni hao” roughly translates to “hello.” The cheery “ni hao ma” is the equivalent of “how are you?” So the symbol HAO seems to be a bit tongue in cheek… sort of like MOO for the Market Vectors Agribusiness ETF, or TAN for the solar energy ETF.
HAO does average volume of just under 263,000 shares, according to the WSJ. It is based on the AlphaShares China Small Cap Index, with sector weightings as follows:
| HAO sector weightings | |
| Industrials | 29.82% |
| Materials | 14.37% |
| Consumer Discretionary | 13.59% |
| Information Technology | 12.86% |
| Financials | 12.28% |
| Consumer Staples | 6.55% |
| Utilities | 4.77% |
| Health Care | 4.74% |
| Telecommunication Services | 0.86% |
| Energy | 0.16% |
Source: Claymore.com
As of this writing, there are 156 different securities included in the China Small Cap ETF, with an average float-adjusted market cap of $1.1 billion. More than 99% of these have a geographic orientation to either China or Hong Kong.
None of the holdings in HAO exceeds 2% of the total, making the weightings pretty evenly distributed – though industrials and materials make up nearly half of the ETF overall. You can see the full exportable list of all 156 HAO names via this page on the Claymore Web site.
Keeping Tabs on the Dragon
China is a big, big story. But with these three ETFs – each with a different profile and focus – you can keep tabs on how the dragon is doing.
FXI, the deeply liquid Dow Jones of China, is all about the “red chips” – and also a useful proxy for China’s financial system, given the heavy weighting toward banks and insurance companies. PGJ, in contrast, gives you a one-shot look at all the U.S.-exchange listed companies, most of them China-based, doing business in China. And HAO keeps you appraised of what’s happening on the small-cap side, with an industrials/materials bias.
In a future episode of our “big dig,” we’ll take a closer look at the China bubble case – and lay out some scenarios for how it might burst.
Source: http://www.taipanpublishinggroup.com/taipan-daily-041610.html
By Justice Litle
http://www.taipanpublishinggroup.com/
Justice Litle is the Editorial Director of Taipan Publishing Group, Editor of Justice Litle’s Macro Trader and Managing Editor to the free investing and trading e-letter Taipan Daily. Justice began his career by pursuing a Ph.D. in literature and philosophy at Oxford University in England, and continued his education at Pulacki University in Olomouc, Czech Republic, and Macquarie University in Sydney, Australia.
Aside from his career in the financial industry, Justice enjoys playing chess and poker; he enjoys scuba diving, snowboarding, hiking and traveling. The Cliffs of Moher in Ireland and Fox Glacier in New Zealand are two of his favorite places in the world, especially for hiking. What he loves most about traveling is the scenery and the friendly locals.
Copyright © 2010, Taipan Publishing Group
Justice_Litle Archive |
© 2005-2022 http://www.MarketOracle.co.uk - The Market Oracle is a FREE Daily Financial Markets Analysis & Forecasting online publication.