Upside Projections for Ford (F)
Companies / Company Chart Analysis May 26, 2010 - 01:24 PM GMTBy: Mike_Paulenoff
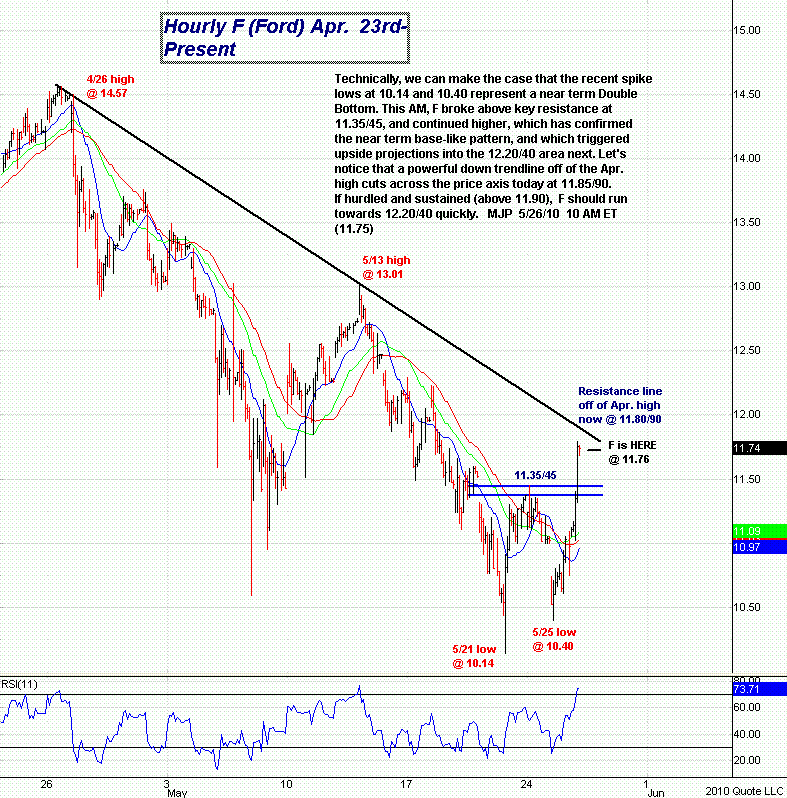
Looking at the hourly chart on Ford (F) since April 23, we can make the case technically that the recent spike lows at 10.14 and 10.40 represent a near-term double-bottom. This morning Ford broke above key resistance at 11.35/45 and continued higher, which has confirmed the near-term, base-like pattern, and which triggered upside projections into the 12.20/40 area next.
Let's notice that a powerful down trendline off of the April high cuts across the price axis today at 11.85/90. If hurdled and sustained (above 11.90), Ford should run towards 12.20/40 quickly.

Sign up for a free 15-day trial to Mike's ETF & Stock Trading Diary today.
By Mike Paulenoff
Mike Paulenoff is author of MPTrader.com (www.mptrader.com), a real-time diary of his technical analysis and trading alerts on ETFs covering metals, energy, equity indices, currencies, Treasuries, and specific industries and international regions.
© 2002-2010 MPTrader.com, an AdviceTrade publication. All rights reserved. Any publication, distribution, retransmission or reproduction of information or data contained on this Web site without written consent from MPTrader is prohibited. See our disclaimer.
Mike Paulenoff Archive |
© 2005-2022 http://www.MarketOracle.co.uk - The Market Oracle is a FREE Daily Financial Markets Analysis & Forecasting online publication.


