Bullish on AMT
Companies / Company Chart Analysis May 28, 2010 - 02:41 PM GMTBy: Mike_Paulenoff
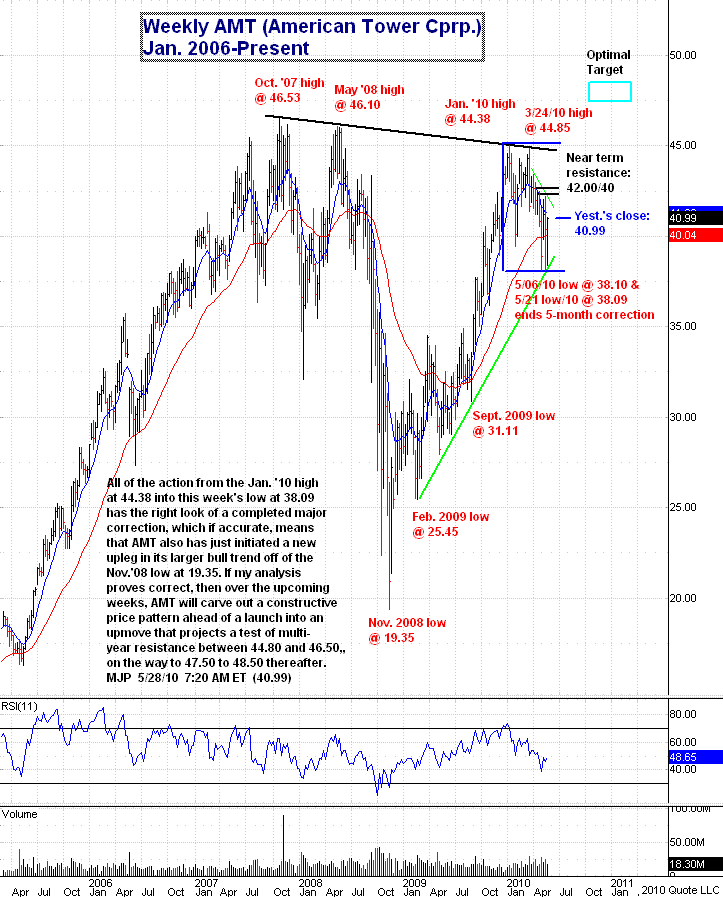
All of the action in American Tower Corp. (NYSE: AMT) from the January 2010 high at 44.38 into this week's low at 38.09 has the right look of a completed major correction, which if accurate means that AMT also has just initiated a new upleg in its larger bull trend off of the November 2008 low at 19.35.
If my analysis proves correct, then over the upcoming weeks AMT will carve out a constructive price pattern ahead of a launch into an upmove that projects a test of multi-year resistance between 44.80 and 46.50, on the way to 47.50 to 48.50 thereafter.

Sign up for a free 15-day trial to Mike's ETF & Stock Trading Diary today.
By Mike Paulenoff
Mike Paulenoff is author of MPTrader.com (www.mptrader.com), a real-time diary of his technical analysis and trading alerts on ETFs covering metals, energy, equity indices, currencies, Treasuries, and specific industries and international regions.
© 2002-2010 MPTrader.com, an AdviceTrade publication. All rights reserved. Any publication, distribution, retransmission or reproduction of information or data contained on this Web site without written consent from MPTrader is prohibited. See our disclaimer.
Mike Paulenoff Archive |
© 2005-2022 http://www.MarketOracle.co.uk - The Market Oracle is a FREE Daily Financial Markets Analysis & Forecasting online publication.


