


Natural Gas Putting in a Bottom
Commodities / Natural Gas Jun 04, 2010 - 09:52 AM GMTBy: Guy_Lerner

 I believe natural gas is putting in a bottom, and it has the potential for an extended bullish run.
Looking at figure 1, which is a monthly chart of the cash data for natural gas, we note that natural gas has gotten crushed over the last 2 years. The indicator in the bottom panel is the "next big thing" and this suggests that natural gas has the technical characteristics of an asset about to undergo a secular trend change from down to up.
Figure 1. Natural Gas/ monthly
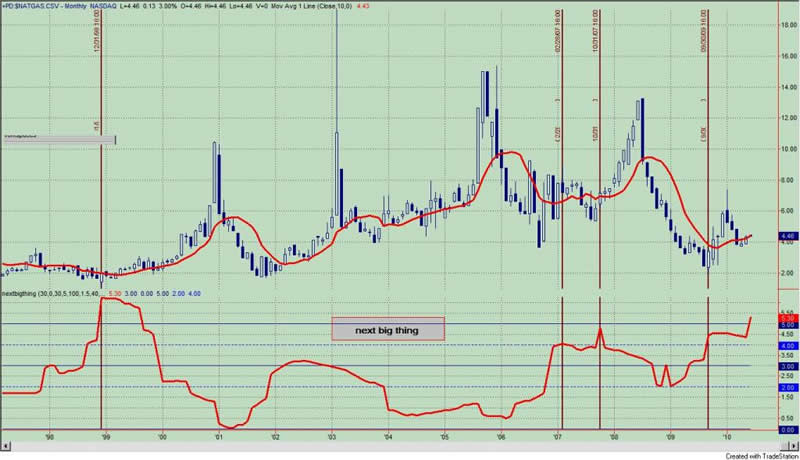
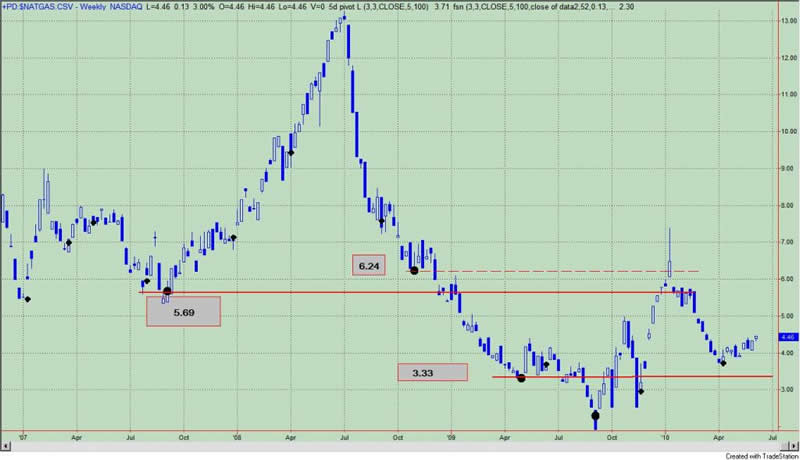
Figure 2 is a weekly chart of the cash data for natural gas. The large black dots are key pivot points or areas where buying and selling are most likely to take place. The smaller black dots are regular pivot points. The close over 2 key pivot points remains bullish, and price is now moving higher above the original breakout point at 3.33. This is also forming a series a higher lows, which is also a positive technical sign.
Figure 2. Natural Gas/ weekly
One of the issues of trading natural gas from a stock perspective has been the vehicle from which we can profit from our observations. The United States Natural Gas Fund (symbol: UNG) appears to be a flawed product primarily because it relies upon futures contracts and the fund is prone to under performance especially if the market is in contango. A new option for those interested in tracking natural gas and it is the i-Path DJ-UBS Natural Gas Total Return Sub Index Exchange Traded Notes (symbol: GAZ). (For those interested about how exchange traded notes (ETN's) work and why they are different than ETF's and why they may be better for tracking commodity indices, I refer you to this article: ETN's.) GAZ is an ETN that trades 200,000 shares a day on average. Figure 3 is a weekly chart of GAZ with key pivot points identified by the black dots.
Figure 3. GAZ/ weekly
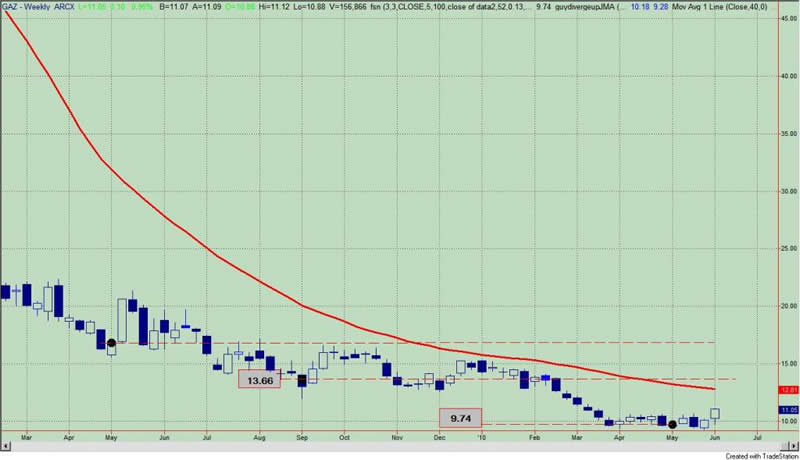
For GAZ, price is currently above the key pivot at 9.74 and this becomes support. The next level of resistance comes in at 13.66.
Lastly, this "call" is purely technical, and fundamental dynamics are not considered for natural gas. While I like to believe that all known information about an asset is contained in the price, some investors may feel more comfortable with a more balanced approach (i.e., fundamental plus technicals). Therefore, this would be a good starting point for your analysis.
By Guy Lerner
http://thetechnicaltakedotcom.blogspot.com/
Guy M. Lerner, MD is the founder of ARL Advisers, LLC and managing partner of ARL Investment Partners, L.P. Dr. Lerner utilizes a research driven approach to determine those factors which lead to sustainable moves in the markets. He has developed many proprietary tools and trading models in his quest to outperform. Over the past four years, Lerner has shared his innovative approach with the readers of RealMoney.com and TheStreet.com as a featured columnist. He has been a regular guest on the Money Man Radio Show, DEX-TV, routinely published in the some of the most widely-read financial publications and has been a marquee speaker at financial seminars around the world.
© 2010 Copyright Guy Lerner - All Rights Reserved
Disclaimer: The above is a matter of opinion provided for general information purposes only and is not intended as investment advice. Information and analysis above are derived from sources and utilising methods believed to be reliable, but we cannot accept responsibility for any losses you may incur as a result of this analysis. Individuals should consult with their personal financial advisors.
Guy Lerner Archive |
© 2005-2022 http://www.MarketOracle.co.uk - The Market Oracle is a FREE Daily Financial Markets Analysis & Forecasting online publication.