


Stock Market Choppy Recoveries and Rally Attempts
Stock-Markets / Stock Markets 2010 Jun 18, 2010 - 09:28 AM GMTBy: Chris_Ciovacco

 Before the open on Friday, the markets remained in a mixed state, with neither the bears nor the bulls having a distinct advantage. From a psychological perspective, the bears have a leg up with recent declines having ignited high levels of fear. The bears also have legitimate concerns about the European debt markets.
The bulls do have some reasons to hope, including:
- The continuing global recovery.
- Improving market breadth in U.S. stocks.
- A weakening U.S. dollar.
- Historical precedent of choppy economic recoveries.
Wide Participation In Rally A Good Sign
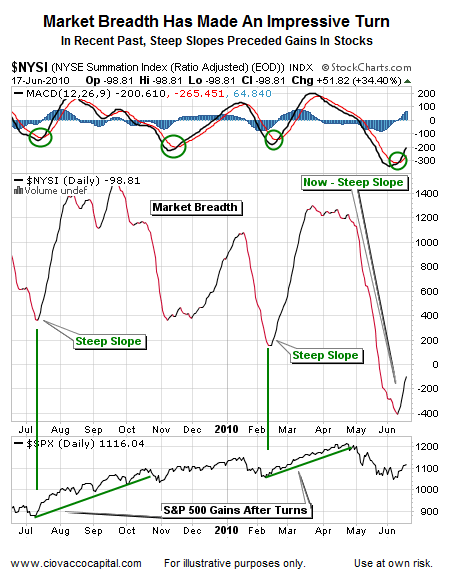
One excellent way to take the stock market’s temperature is to study breadth. Market breadth refers to the number of stocks participating in a given rally (advancers vs. decliners). The Summation Index is an intermediate-term measure of market breadth. In the chart below, notice the S&P 500’s performance after the Summation Index makes a sharp turn up (steep slope). The S&P 500 is shown below the Summation Index. Compare the current move in the Summation Index (right side of chart) to recent moves (left); they look very similar, which leans bullish.
Less Demand For Dollar’s Safe Haven
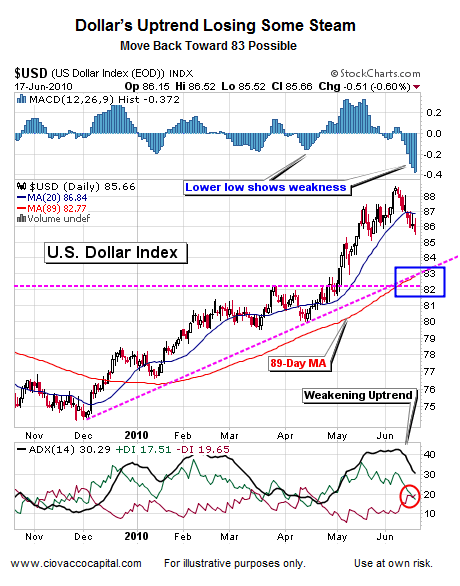
The U.S. dollar has served as a "safe haven" currency during recent periods of turmoil in the financial markets, which is ironic given the ever-growing debt problems in the United States. While the dollar’s uptrend remains intact, it is showing some cracks. A countertrend move back toward the pink trend and support lines may be in the cards (see chart below). In general, a weakening dollar tends to support risk assets such as stocks, commodities, and commodity-dependent currencies. Moving Average Convergence-Divergence (MACD) is one of the simplest and most effective momentum indicators available. Notice the MACD histogram (blue vertical bars at top of chart), made a significantly lower low during the dollar’s current decline. A lower low can be indicative of negative momentum building steam.
S&P 500: Bulls & Bears Butt Heads
While the dollar appears to be weakening, the S&P 500 is trying to switch from an intermediate downtrend to an intermediate uptrend. Compare and contrast the MACD histograms (blue bars) for the dollar and S&P 500. The S&P 500’s MACD histogram made a series of higher lows during the recent nerve-racking declines; this is indicative of a weakening downtrend (see green arrows below). On the positive side of the ledger, the MACD blue vertical bars on the S&P 500’s chart recently made the highest high we have seen in several months, indicating a strengthening uptrend (upper right corner of chart shown below).
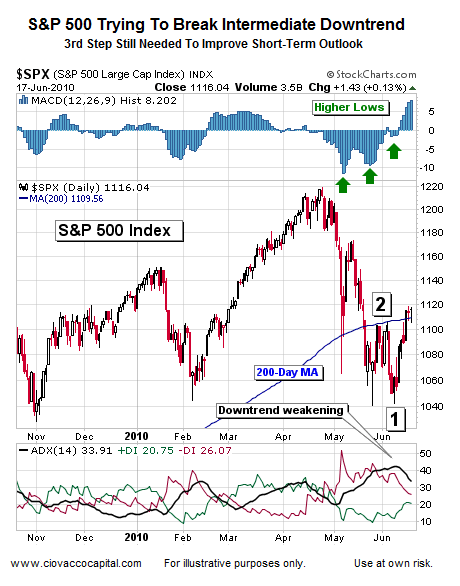
ADX is an indicator used to monitor the strength of a trend, either up or down. ADX is shown at the bottom of the chart above. Notice when the black ADX line "rolls over" from high levels, a change in trend can follow. The good news for the bulls is the ADX black line has rolled over, increasing the odds stocks may rally further.
The S&P 500 has made two steps toward completing a basic trend change (from down to up). First, the intraday low on 5/25/10 was 1,040; a higher low was made on 6/8/10 coming in at 1,042. The second step toward a possible change in trend was completed on 6/15/10 when the intraday high of 1,115 exceeded the intraday high of 1,105 made on 6/3/10. This is all good news, but it means little if the next decline cannot produce another higher low, followed by a higher high. Another move below 1,040 would possibly open the door to lower ranges for the S&P 500, including 1,020-1,030 and 991-996.
More Shorts or Short Covering?
The S&P 500 is also attempting to retake its 200-day moving average (MA), successfully closing above it on Tuesday, Wednesday, and Thursday (see blue line in chart above). Closing above it for three days is a step in the right direction, but it is not all that significant until the market can move decisively away from the 200-day MA, which is now at 1,109. Markets often cling to the 200-day for a few days and then make a decisive move one way or another (up or down). If the S&P 500 can move decisively above the 200-day MA, the shorts may run for cover giving additional momentum to the upside. However, the same can be said of a decisive move below the 200-day MA; it may attract more shorts and increase the downside momentum. In this light, it is easy to understand why many traders are reluctant to make moves until we get a break up or down.
Recoveries Tend To Be Choppy
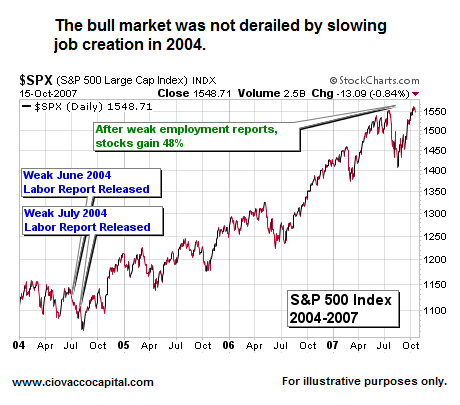
In the context of history, the June 6, 2010 weak job numbers are not all that troubling. The current market and economic cycles are very similar to what we saw between March 2003 and June 2004. The last bull market had to endure five months of slowing job growth in 2004, including "terrible" job creation of less than 100K in the summer of 2004 (sounds familiar). Like 2010, stocks corrected in 2004, and it felt like a new bear market had started.
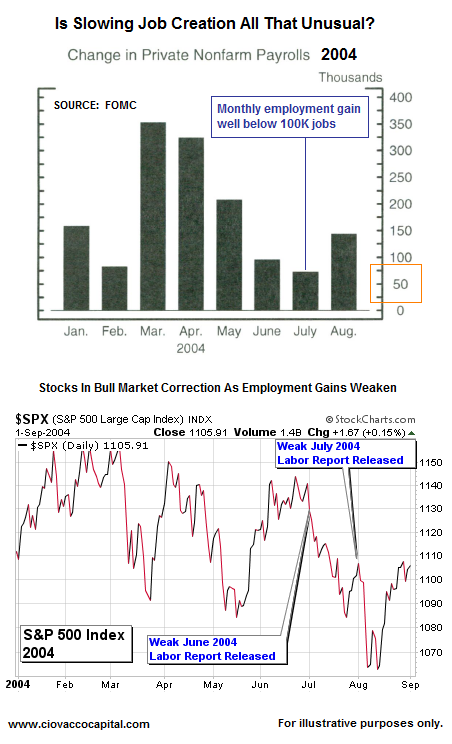
Stocks did quite well after five months of slowing job growth in 2004. Those who remained patient were generously rewarded with gains approaching 50% from the 2004 correction lows. Every cycle has some unique characteristics, but they also have numerous similarities. The events of 2004 remind us the importance of understanding history and keeping an open mind (which is not easy to do in the face of falling markets).
We may still have a few weeks or a few months of difficult times, including some more disappointing reports on the employment front, but at this point the odds still favor higher highs in stocks later in 2010 or in 2011. A new bear market is possible, but not probable with the information we have in hand. We respect there are still problems with banking, debt, and credit, but we should get little to no movement from the Fed for the balance of 2010 (which was not the case in 2004).
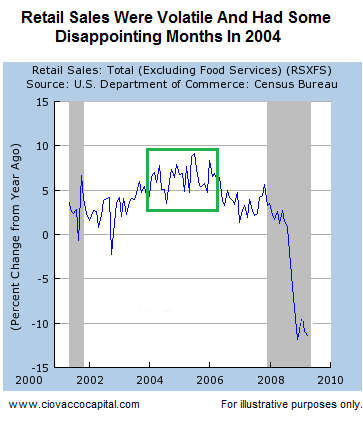
On the retail front, sales announced on June 11, 2010 were weak. Just as employment gains in this part of the economic cycle can be choppy and disappointing at times, the same applies to retail sales (see the green box in the chart below). Despite choppy retail sales, the S&P 500 gained 48% off the 2004 lows. This week's numbers were not good, but it is also not that surprising given the stock market’s poor performance in May.
Hope for the Best, Plan for the Worst
There is a reason our analysis leans toward the bullish end of the spectrum. Our historical market models remain bullish longer-term, which means we will err on the side of staying with the bull market. However, it is important to have a detailed exit strategy in place in the event recent declines evolve into a more serious and lasting bear market.
Recent S&P 500 intraday lows hit 1,042 and 1,040. The closing lows were 1,062 and 1,050, which tells us that longer-term support below 1,050 has some meaning in the minds of traders. Going back as far as the late 1990s, longer-term areas of support, come in at 1,048, 1,045, and 1,040. A break of 1,040 could open the door to 1,030, 1,018, and 978. While it would be painful, a drop to 945 cannot be ruled out, since corrections/mini bear markets in 1990 and 1998 saw stocks drop roughly 22% before rallying more than 60%. This scenario is the most difficult to manage through in terms of balancing the need to protect hard-earned capital and remaining invested to capture what could be significant gains after a correction/mini bear market. These are the things that keep money managers up at night. Part of being prepared is not only having strategies and tactics in place for such an unfavorable intermediate outcome, but also to become mentally and emotionally prepared for the possibility of having to make decisions under even higher levels of stress. This is not the time to be skipping workouts or long runs. If you understand and accept now that a 22% decline from the April highs has historical precedent, it will be easier to make decisions should history repeat itself.
Additional comments can be found in Short Takes.
By Chris Ciovacco
Ciovacco Capital Management
Copyright (C) 2009 Ciovacco Capital Management, LLC All Rights Reserved.
Chris Ciovacco is the Chief Investment Officer for Ciovacco Capital Management, LLC. More on the web at www.ciovaccocapital.com
Ciovacco Capital Management, LLC is an independent money management firm based in Atlanta, Georgia. As a registered investment advisor, CCM helps individual investors, large & small; achieve improved investment results via independent research and globally diversified investment portfolios. Since we are a fee-based firm, our only objective is to help you protect and grow your assets. Our long-term, theme-oriented, buy-and-hold approach allows for portfolio rebalancing from time to time to adjust to new opportunities or changing market conditions. When looking at money managers in Atlanta, take a hard look at CCM.
All material presented herein is believed to be reliable but we cannot attest to its accuracy. Investment recommendations may change and readers are urged to check with their investment counselors and tax advisors before making any investment decisions. Opinions expressed in these reports may change without prior notice. This memorandum is based on information available to the public. No representation is made that it is accurate or complete. This memorandum is not an offer to buy or sell or a solicitation of an offer to buy or sell the securities mentioned. The investments discussed or recommended in this report may be unsuitable for investors depending on their specific investment objectives and financial position. Past performance is not necessarily a guide to future performance. The price or value of the investments to which this report relates, either directly or indirectly, may fall or rise against the interest of investors. All prices and yields contained in this report are subject to change without notice. This information is based on hypothetical assumptions and is intended for illustrative purposes only. THERE ARE NO WARRANTIES, EXPRESSED OR IMPLIED, AS TO ACCURACY, COMPLETENESS, OR RESULTS OBTAINED FROM ANY INFORMATION CONTAINED IN THIS ARTICLE. PAST PERFORMANCE DOES NOT GUARANTEE FUTURE RESULTS.
Chris Ciovacco Archive |
© 2005-2022 http://www.MarketOracle.co.uk - The Market Oracle is a FREE Daily Financial Markets Analysis & Forecasting online publication.