


Yellow and Black Gold Shine Compared to the Stocks SP500 Index
Commodities / Commodities Trading Aug 05, 2010 - 03:00 AM GMTBy: Chris_Vermeulen

 Commodities have been shining recently as the US Dollar loses its luster for investors. Also the weakening dollar has helped boost equities as a lower US dollar helps the large multi national companies. This report is a quick follow up from the Weekend report showing what the odds were favoring which was higher gold, oil and sp500. As of today each investment is unfolding as planned, once candle at a time.
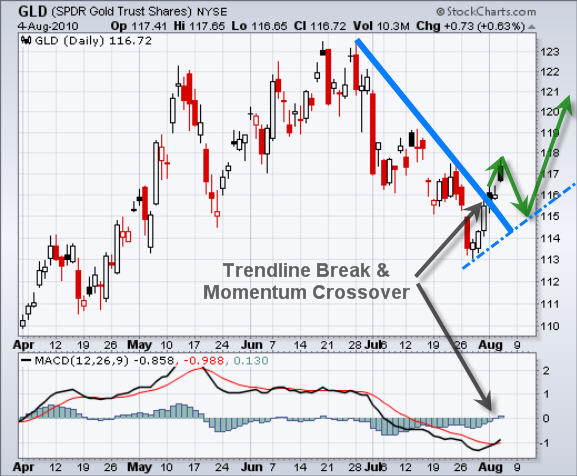
GLD – Gold ETF Trading
In my last report I pointed out how gold needed to break through its down trendline, the MACD had to crossover and then we needed to wait for a pullback which ends with a reversal candle to the upside. It seems gold is working its way through that process now.
Today’s Pop & Drop is not bullish price action and I expect we see a couple more down/sideways days before higher prices are reached. There are two bullish ways gold could pullback. First one would be a drop to $115 area with below average volume which could form the right shoulder of a reverse head & shoulders pattern, or we could see prices just fade sideways on light volume for 2-4 days before another up move starts.
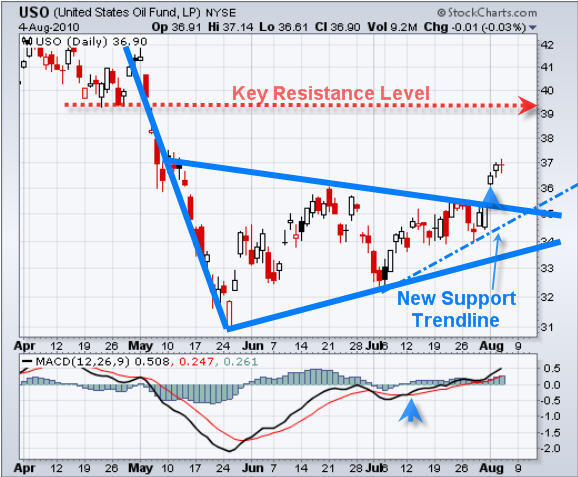
USO – Oil Trading Fund
Oil just had a 3 day pop and with today’s doji candle the chart is saying it needs a breather. That also falls inline with the price of the US dollar which should continue higher tomorrow (Thursday Aug 5th) putting downward pressure on crude oil.
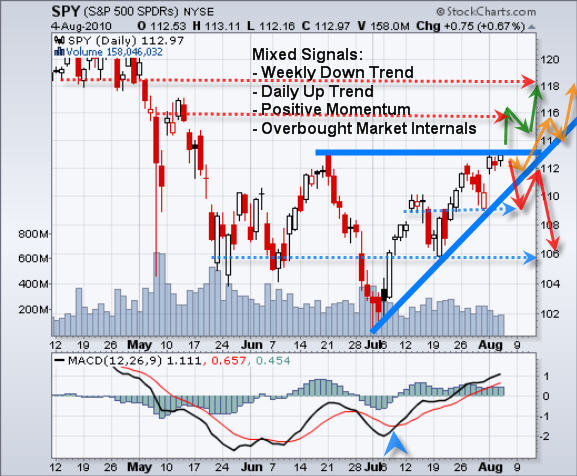
SPY – SP500 ETF Trading Signals
SP500 had a nice pop on Monday taking it up to the first key resistance level. The best play would have been to buy last Thursday or Friday when it dropped down to support unfortunately the intraday charts at that time were not that healthy looking.
I am not a fan of trading breakouts because so many of them fail and you end up paying a premium for your position and they can end up going against you very quickly. Rather I focus on trying to pick things up at support or sell them at resistance.
If we see the price pause for another 1-4 days on light volume and hold above the support trendline we could have a great low risk entry point with a stop set just below support. Or we could see a pop then pullback to test the breakout level as which point we can take a long position. This play needs to mature a little more.
Mid-Week Gold, Oil and Index Trading Conclusion:
In short, Gold, Oil and the SP500 look ready for a small pullback or some sideways price action. It will be interesting to see how strong the pullback will be on the SP500. The chart pattern and volume while they favor higher prices at the moment, if the support trendline is breached then selling volume will most likely spike and a sharp decline will occur causing the SP500 to drop approximately 3% all the way down to the $109 area.
Well, that’s it for now. If you would like to test out my trading service which has a 30 day money back guarantee visit my site at: www.TheGoldAndOilGuy.com
By Chris Vermeulen
Chris@TheGoldAndOilGuy.com
Please visit my website for more information. http://www.TheGoldAndOilGuy.com
Chris Vermeulen is Founder of the popular trading site TheGoldAndOilGuy.com. There he shares his highly successful, low-risk trading method. For 6 years Chris has been a leader in teaching others to skillfully trade in gold, oil, and silver in both bull and bear markets. Subscribers to his service depend on Chris' uniquely consistent investment opportunities that carry exceptionally low risk and high return.
This article is intended solely for information purposes. The opinions are those of the author only. Please conduct further research and consult your financial advisor before making any investment/trading decision. No responsibility can be accepted for losses that may result as a consequence of trading on the basis of this analysis.
Chris Vermeulen Archive |
© 2005-2022 http://www.MarketOracle.co.uk - The Market Oracle is a FREE Daily Financial Markets Analysis & Forecasting online publication.