GM Bullish Chart Pattern
Companies / Company Chart Analysis Nov 24, 2010 - 01:08 PM GMTBy: Mike_Paulenoff
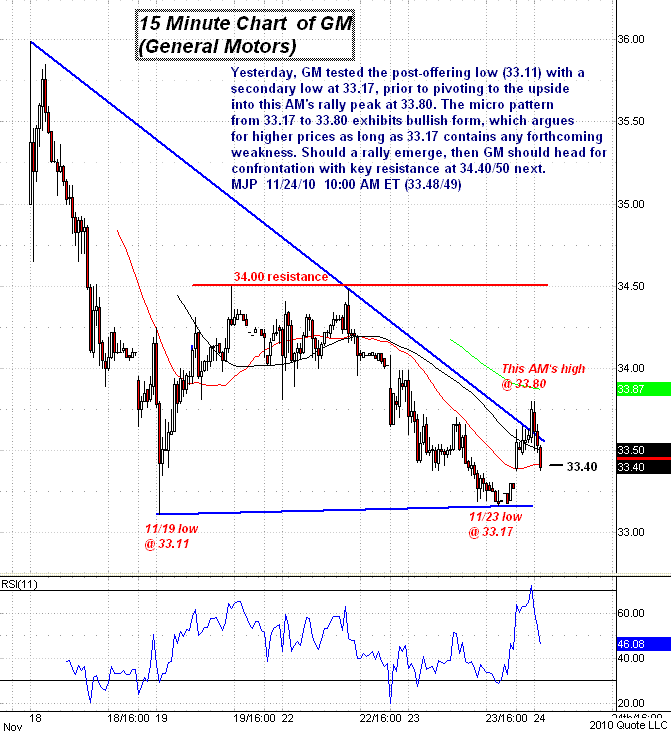
Yesterday General Motors (NYSE: GM) tested the post-offering low (33.11) with a secondary low at 33.17, prior to pivoting to the upside into this morning's rally peak at 33.80. The micro pattern from 33.17 to 33.80 exhibits bullish form, which argues for higher prices as long as 33.17 contains any forthcoming weakness.
Should a rally emerge, then GM should head for a confrontation with key resistance at 34.40/50 next.

Sign up for a free 15-day trial to Mike's ETF & Stock Trading Diary today.
By Mike Paulenoff
Mike Paulenoff is author of MPTrader.com (www.mptrader.com), a real-time diary of his technical analysis and trading alerts on ETFs covering metals, energy, equity indices, currencies, Treasuries, and specific industries and international regions.
© 2002-2010 MPTrader.com, an AdviceTrade publication. All rights reserved. Any publication, distribution, retransmission or reproduction of information or data contained on this Web site without written consent from MPTrader is prohibited. See our disclaimer.
Mike Paulenoff Archive |
© 2005-2022 http://www.MarketOracle.co.uk - The Market Oracle is a FREE Daily Financial Markets Analysis & Forecasting online publication.


