Mini Base-like Pattern for Bank of America (BAC)
Companies / Company Chart Analysis Nov 29, 2010 - 04:20 PM GMTBy: Mike_Paulenoff
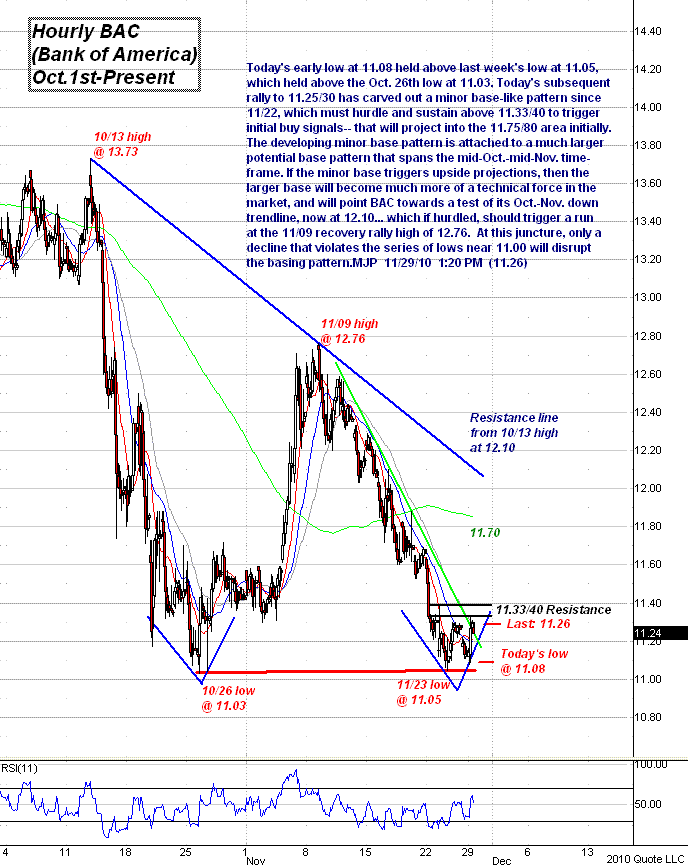
11.08 held above last week's low at 11.05, which held above the October 26 low at 11.03. Today's subsequent rally to 11.25/30 has carved out a minor base-like pattern since Nov 22, which must hurdle and sustain above 11.33/40 to trigger initial buy signals that will project into the 11.75/80 area initially.
The developing minor base pattern is attached to a much larger potential base pattern that spans the mid-October to mid-November time frame. If the minor base triggers upside projections, then the larger base will become much more of a technical force in the market, and will point BAC towards a test of its Oct-Nov. down trendline, now at 12.10.
If hurdled, this should trigger a run at the 11/09 recovery rally high of 12.76. At this juncture, only a decline that violates the series of lows near 11.00 will disrupt the basing pattern.

Sign up for a free 15-day trial to Mike's ETF & Stock Trading Diary today.
By Mike Paulenoff
Mike Paulenoff is author of MPTrader.com (www.mptrader.com), a real-time diary of his technical analysis and trading alerts on ETFs covering metals, energy, equity indices, currencies, Treasuries, and specific industries and international regions.
© 2002-2010 MPTrader.com, an AdviceTrade publication. All rights reserved. Any publication, distribution, retransmission or reproduction of information or data contained on this Web site without written consent from MPTrader is prohibited. See our disclaimer.
Mike Paulenoff Archive |
© 2005-2022 http://www.MarketOracle.co.uk - The Market Oracle is a FREE Daily Financial Markets Analysis & Forecasting online publication.


