Big-Picture Pattern Still Bullish for China FXI ETF
Stock-Markets / Chinese Stock Market Dec 15, 2010 - 01:00 PM GMTBy: Mike_Paulenoff
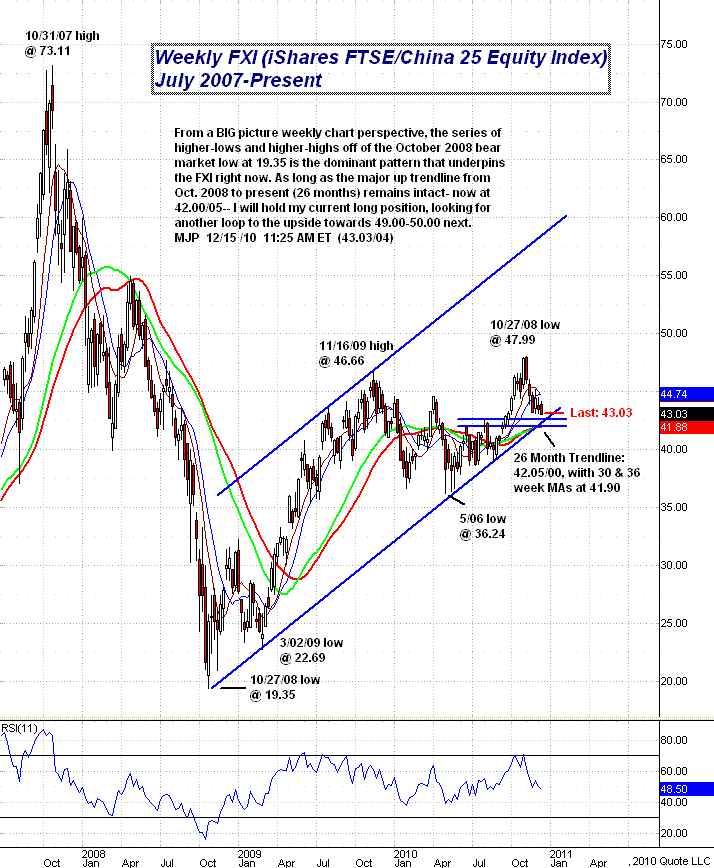
From a big picture weekly chart perspective, the series of higher lows and higher highs off of the October 2008 bear market low at 19.35 is the dominant pattern that underpins the iShares FTSE/China 25 Equity Index (NYSE: FXI) right now.
As long as the major up trendline from October 2008 to the present (26 months) remains intact, now at 42.00/05, we will be looking for another loop to the upside towards 49.00-50.00 next.

Sign up for a free 15-day trial to Mike's ETF & Stock Trading Diary today.
By Mike Paulenoff
Mike Paulenoff is author of MPTrader.com (www.mptrader.com), a real-time diary of his technical analysis and trading alerts on ETFs covering metals, energy, equity indices, currencies, Treasuries, and specific industries and international regions.
© 2002-2010 MPTrader.com, an AdviceTrade publication. All rights reserved. Any publication, distribution, retransmission or reproduction of information or data contained on this Web site without written consent from MPTrader is prohibited. See our disclaimer.
Mike Paulenoff Archive |
© 2005-2022 http://www.MarketOracle.co.uk - The Market Oracle is a FREE Daily Financial Markets Analysis & Forecasting online publication.


