


Time To Play Defense Before Buying Stocks Again
Companies / Company Chart Analysis Jan 20, 2011 - 03:45 PM GMTBy: David_Grandey

 Today’s buzzword is DEFENSE
As a lot of you football fans will find out this weekend, no matter how good your offense is you can not get to the Superbowl without a good defense!
We talked about the market being Over Extended, Overbought, Over and Over again not to mention and how at any time the monkey could flip the switch. Well guess what, the monkey flipped the switch!
For the last few months we’ve been easily 50% cash and operated from a opportunistic standpoint vs. full speed ahead buy, buy buy and now you know why. That’s playing defense.
Make no mistake, yesterday in the broad market was an ugly day. Today is too as well in the growth oriented names . Especially the over-owned, over-loved tech screamers that have been priced to perfection.
FFIV sneezed last night and that was all it took to knock the wind out of the sails of numerous screamers over the last 3-4 months. So how come we didn’t take a “In The Face Of Fear ” trade on the long side with it? Simple.
We only do that with issues in CLEARLY DEFINED UPTRENDS ABOVE THE 50 DAY. Take a look at the chart below, you tell me is this issue in a clearly defined uptrend?
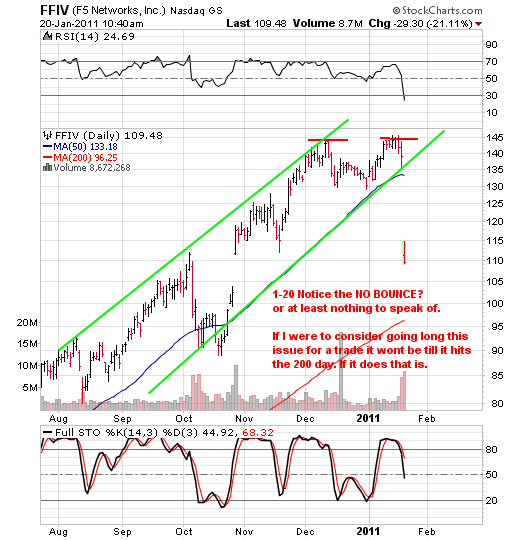
Is FFIV above the 50 day?
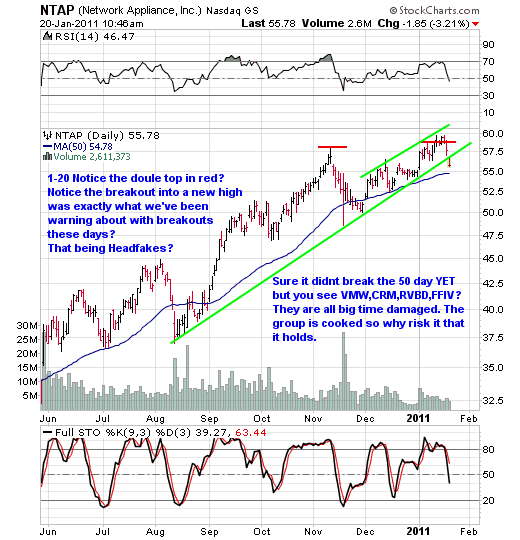
Not anymore! In fact it had a double top going into earnings here as shown and so has NTAP too by the way. Think, “Nice Uptrend, Puts in a Double Top, and then breaks to the downside. That’s been a mantra around here when it comes to change in trend patterns from up to down. And when you get some key market leading names start to do that? That makes us stand up and take notice.
There is a good possibility that before all is said and done that this is the first shot across the bow for a deeper pullback. We all knew it was coming but nobody knew when. Usually it takes a cataylst and that MAY have been FFIV’s failing to impress in last night’s earnings report.
What remains to be seen is whether or not this is just a much deserved pullback to relieve some over excess or the start of something bigger. We’re leaning to something bigger over time. Think First Thrust Down (what’s happening today in the cloud stocks), snapback rally and then bombs away to the downside. Here’s a great example of a stock that recently went through this process:
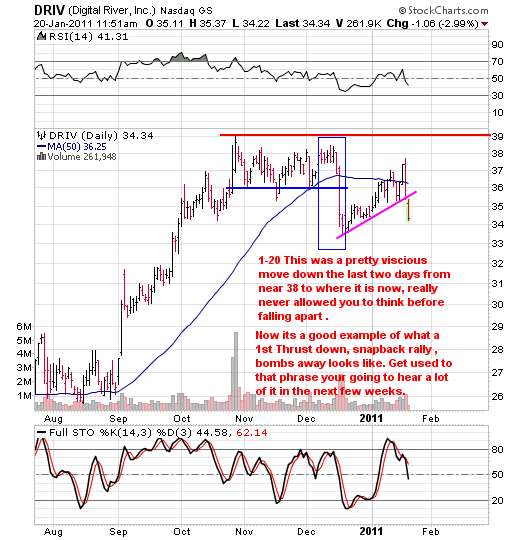
The blue box is the first thrust down, the pink bear channel is the snapback rally and upon a downside break of the pink bear channel that is the bombs away.
Numerous names in the growth space are taking it on the chin here and rightfully so. The markets have pushed these names up, up and away with many over the past 6 months putting on over 100% gains. Just look at charts of APKT, NTAP and RVBD to name a few.
As for the indexes? Let’s look at the daily charts.
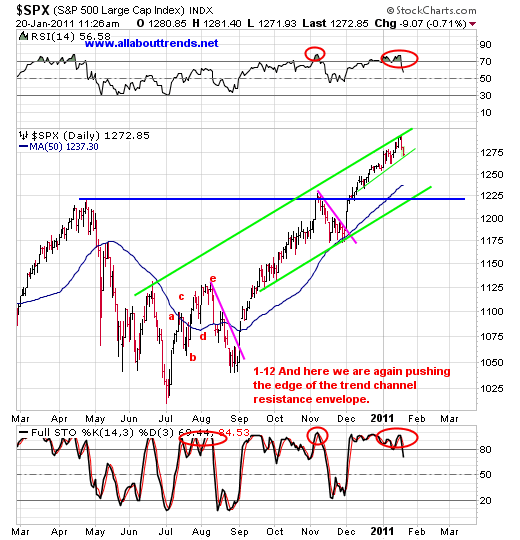
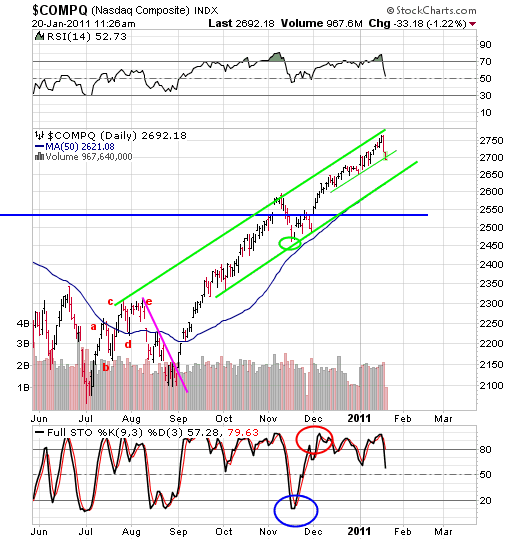
As you can see, the thin green lines are those that are always on the 60-minute charts we show quite a bit around here. You can also see we are hanging around at them for the time being. But you can also see that the major green lines/50 day averages are still a ways away.
Over the coming days/weeks there is a good possibility that we head for the 50 day averages on the indexes before we get any sort of meaningful bounce. It’s at that point, we’ll want to get serious on the long side for some killer trades and at the rate we are going it isn’t going to take long.
We’ve talked numerous times about how the 50-day average tends to act as a support level and typically gets defended. With the indexes it’s no different. In fact if we were an index investor looking to get long for a trade? It would be at the 50 day average.
For us? Until we get to the 50 day average there is nothing to consider on the long side to buy.
By David Grandey
www.allabouttrends.net
To learn more, sign up for our free newsletter and receive our free report -- "How To Outperform 90% Of Wall Street With Just $500 A Week."
David Grandey is the founder of All About Trends, an email newsletter service revealing stocks in ideal set-ups offering potential significant short-term gains. A successful canslim-based stock market investor for the past 10 years, he has worked for Meriwest Credit Union Silicon Valley Bank, helping to establish brand awareness and credibility through feature editorial coverage in leading national and local news media.
© 2011 Copyright David Grandey- All Rights Reserved
Disclaimer: The above is a matter of opinion provided for general information purposes only and is not intended as investment advice. Information and analysis above are derived from sources and utilising methods believed to be reliable, but we cannot accept responsibility for any losses you may incur as a result of this analysis. Individuals should consult with their personal financial advisors.
© 2005-2022 http://www.MarketOracle.co.uk - The Market Oracle is a FREE Daily Financial Markets Analysis & Forecasting online publication.