


U.S. Real Unemployment Rate 10.2%, Underemployment at 20%
Economics / Unemployment Mar 20, 2011 - 04:36 AM GMTBy: Mike_Shedlock

 I am very skeptical of BLS unemployment rates inching lower. Not only do the BLS reports discount millions of marginally attached and discouraged workers but BLS seasonal adjustments seem more than a bit unusual.
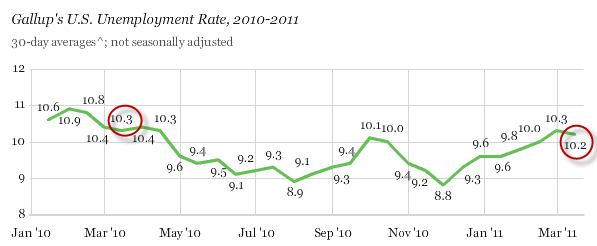
Gallup polls paint a far different picture. Please consider Gallup Finds U.S. Unemployment at 10.2% in Mid-March
Unemployment Rate
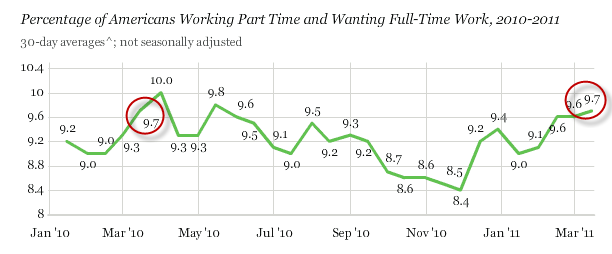
Part-Time Workers Wanting Full-Time Job
Underemployment
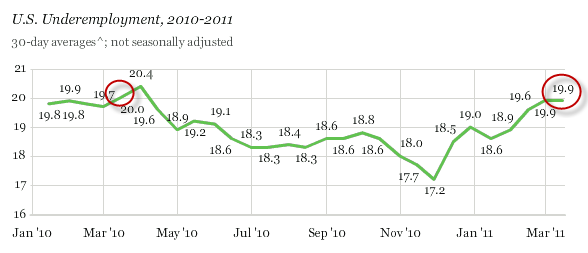
The only valid way to compare not seasonally-adjusted numbers is to compare the numbers to the same month a year ago. I added the red circles on the above charts to show just that.
Note that year-over-year comparisons of the unemployment rate, the underemployment rate, and the part-time for economic reasons rate, all show no significant change compared to a year ago.
Meanwhile the BLS would have you believe the unemployment rate fell from 9.7% to 8.9% over the course of the last year.
Jobs Situation About the Same as It Was a Year Ago
The government's February report on the U.S. unemployment situation suggests that 192,000 jobs were created last month and the unemployment rate declined to 8.9%, down from 9.7% a year ago. Federal Reserve Bank of New York President William Dudley and others said they were encouraged by this report.
However, Gallup's unemployment and underemployment measures have not shown the same gains in early 2011. Gallup finds an unemployment rate (10.2%) and an underemployment rate (19.9%) for mid-March that are essentially the same as those from mid-March 2010.
In part, the difference between Gallup's and the government's current job market assessments may be due to the government's seasonal adjustments. Gallup's U.S. unemployment rate is also more up-to-date -- its mid-March data include jobless figures for much of March, whereas the government's latest unemployment rate is based on the jobs situation in mid-February.
Most importantly, a key reason the government's unemployment rate is dropping apparently has to do with the so-called participation rate: the percentage of Americans who are counted as being in the workforce. The government's participation rate in February was at its lowest level since 1984. In essence, this tends to suggest that the government's unemployment rate may be declining because many people are becoming discouraged and leaving the workforce -- not because they are getting new jobs.
If this is the case, then neither Gallup's unemployment report nor that provided by the government is good news for the economy. It is equally bad news if people are out of work and looking for a job or just too discouraged to say they continue to do so. Either way, a lack of sufficient job creation to increase employment among those who want to work remains a major obstacle to U.S. economic growth in the months ahead.
Gallup offers reasonable commentary. There is no reason to be excited over the BLS dip in the unemployment rate.
Here is another way of looking at it, using the BLS' own numbers.
Nonfarm Payroll Employment - Seasonally Adjusted Total
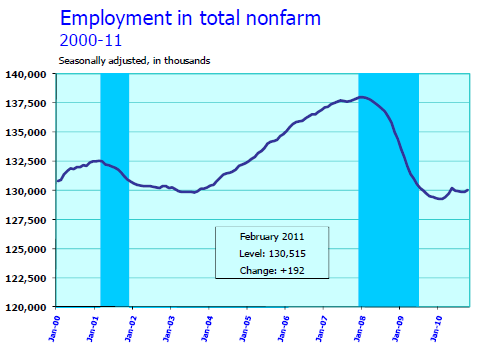
According to the BLS, non-farm employment is lower than it was in 2002!
Household Data
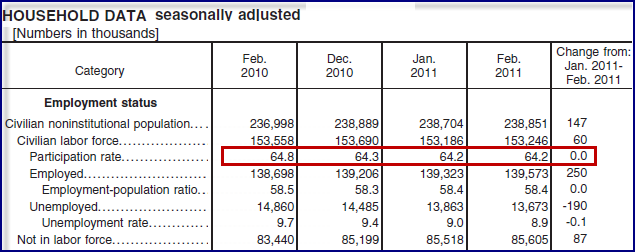
In the last year, the civilian population rose by 1,853,000. Yet the labor force dropped by 312,000. Those not in the labor force rose by 2,165,000.
In January alone, a whopping 319,000 people dropped out of the workforce. In February (this months' report) another 87,000 people dropped out of the labor force.
Were it not for people dropping out of the labor force, the unemployment rate would be over 11% (Rosenberg pegs it at 12%).
On a year-over-year basis the number of people employed dropped by 125,000 yet we are supposed to believe things are getting better. From a jobs standpoint the best we can say is things are no longer getting worse. However, we can also state the BLS unemployment rate is a complete distortion of reality.
Finally, take a look at that employment chart and tell me where the demand for housing is going to come from. Here's a hint: you can't do it. For further discussion of housing, please see Shrinking Labor Pool Means Shrinking Demand For Housing.
By Mike "Mish" Shedlock
http://globaleconomicanalysis.blogspot.com Click Here To Scroll Thru My Recent Post List
Mike Shedlock / Mish is a registered investment advisor representative for SitkaPacific Capital Management . Sitka Pacific is an asset management firm whose goal is strong performance and low volatility, regardless of market direction.
Visit Sitka Pacific's Account Management Page to learn more about wealth management and capital preservation strategies of Sitka Pacific.
I do weekly podcasts every Thursday on HoweStreet and a brief 7 minute segment on Saturday on CKNW AM 980 in Vancouver.
When not writing about stocks or the economy I spends a great deal of time on photography and in the garden. I have over 80 magazine and book cover credits. Some of my Wisconsin and gardening images can be seen at MichaelShedlock.com .
© 2011 Mike Shedlock, All Rights Reserved.
© 2005-2022 http://www.MarketOracle.co.uk - The Market Oracle is a FREE Daily Financial Markets Analysis & Forecasting online publication.