


Kress Cycle Economic Tsunami
Economics / Cycles Analysis Jun 13, 2011 - 03:07 PM GMTBy: Clif_Droke

 Forgotten in the avalanche of economic headlines in recent weeks is the fact that the housing market hit a new low. In the latest reporting month the national housing index hit a new low, falling below the previous low from April 2009. This should be prompting a nationwide debate in the press as to whether a new down leg in the housing market lies ahead. Instead, all we hear is crickets.
Although it tends to be forgotten or downplayed at times, the housing market peak in 2005 is what started the financial and economic crisis, the effects of which are still being felt. The yearly appreciation in housing prices which was formerly taken for granted and was a major engine of consumer spending by way of home equity loans. Now that falling home prices is an accepted reality for millions of home owners, consumer spending has been dampened and the economy has been stagnant ever since.
In order to gain some perspective, let’s take a look at the overall economic situation from the standpoint of the long-term Kress cycles. The destruction of the U.S. economy has occurred in at least three stages – with a fourth to occur later this year. The fifth and final stage should be well underway by no later than 2013. The entire 5-stage cyclical process by which the economy is broken down can be likened to a storm, gaining in intensity with each passing stage. The final forthcoming stage can be called the Kress Cycle Tsunami. We’ll break down these five stages in the report that follows.
The first stage of the gradual economic breakdown occurred in late 1999/early 2000. At that time the 30-year component of the long-term Kress super cycle peaked. It resulted in the demise of the great 1990s bull market in stocks. The Internet stock bubble which held sway at the time imploded and the white hot ‘90s economy was drastically cooled off. Along with it the era of the strong dollar and cheap commodities came to a crashing halt.
In an effort to revive the economy and stimulate the financial market after the 2000 Internet stock crash, the Federal Reserve embarked on an easy money campaign in which the dollar was devalued and interest rates were driven to levels not seen since 1945. The result of this cheap money scheme was a massive housing bubble along with an economic resurgence.
But something happened to upset the revival. The Kress 20-year cycle peaked in late 2004, which removed a major support from the economy. It also dealt a fatal blow to the real estate bubble. Five years after the real estate market collapsed a bottom has yet to be made. This was Stage Two of the developing Kress cycle super storm.
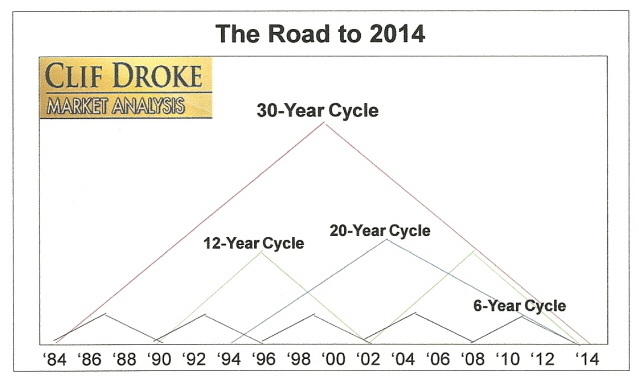
The economy suffered its next major setback in 2008 when the Kress 12-year cycle peaked. The credit crash that came later that year was a direct consequence of the real estate collapse and was exacerbated by the peaking of the 12-year cycle. This was Stage Three of the economy’s destruction.
Stage Four of the Kress cycle storm will occur around the fourth quarter of this year when the 6-year cycle peaks. You’ll notice by now that pattern has been established: each time a major yearly cycle peaks, the economy falters and we arrive one step closer to the eventual Kress Cycle Tsunami when then all the yearly cycles comprising the 120-year Grand Super cycle will be in the final “hard down” phase. This event hasn’t been seen since the 1890s, which catalyzed the industrial depression of that decade and saw the transformation of the U.S. from a primarily agrarian economy to an industrial one.
The financial market rebound of 2009-2011 was made possible both by an aggressive easy money policy by the Fed as well as by the peaking phase of the 6-year cycle (the previous 6-year cycle bottomed in late 2008). Fed Chairman Bernanke caught a huge break by virtue of the peaking 6-year cycle, otherwise it’s doubtful his monetary policy would have succeeded in reviving the financial market for as long as it did. Bernanke won’t be so lucky once the 6-year cycle peaks, however. As we head closer to the fateful 2013-2014 period when the economic headwinds should be at their fiercest, any attempt at reviving the economy through currency manipulation will almost certainly fail.
The fifth and final stage of the unfolding Kress cycle storm should be seen at some point in 2012 once the residual momentum from the current recovery has long since dissipated and none of the major long-term cycles are in the ascending phase. Starting next year, every component of the 120-year cycle (the lowly 4-year cycle being the only exception) will be down.
As we continue to experience the unfolding of the various stages of the brewing Kress cycle storm it will be especially important to watch the housing market for clues as to whether deflationary forces are increasing. The economic crisis started with real estate and it stands to reason that housing will be probably be the first major economic sector to bottom out after the 2014 Grand Super cycle bottoms. From now until then, there remains a lot more downside potential in real estate.
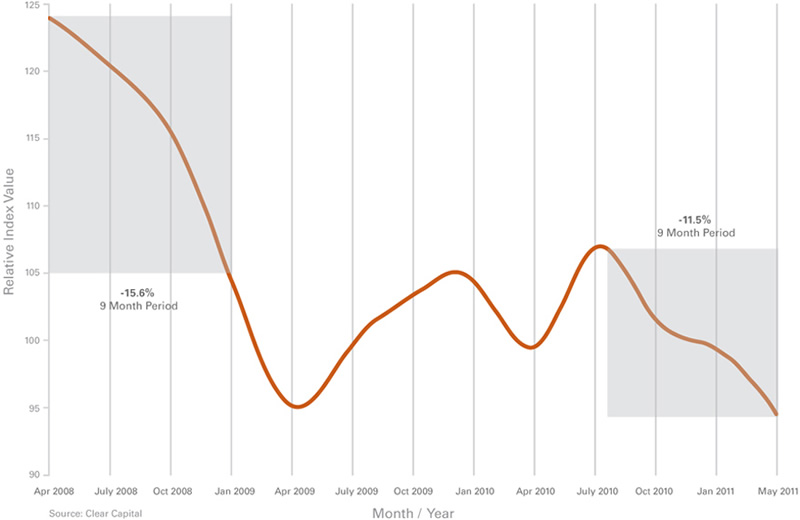
The latest issue of the Campbell Real Estate Timing Letter (www.RealEstateTiming.com) begins with the following timely headline: “It’s official: The housing market has not bottomed.” As real estate expert and editor Robert Campbell points out, the April 2011 home price index from Clear Capital (see chart below) shows that U.S. housing prices have double dipped and are now 0.7 percent below their prior lows experienced in March 2009.
Campbell warns, “Be aware that the falling U.S. housing market we are now witnessing is caught in a self-reinforcing negative feedback loop, whereby falling prices bring more distressed supply to the marketplace because more and more homeowners with mortgages are now underwater – which in turn causes them to ‘walk away’ in greater and greater numbers.” He further cautions that “a growing number of homeowners that are not upside down on their properties – and thus do have equity – will likely decide to put their homes up for sale to try to preserve their capital before it shrinks even more.”
Reversion to the mean calculations suggest a further 15-to-20 percent decline in national real estate prices from current levels, according to Campbell. If it happens, this would result in a 45-to-50 percent peak-to-trough total decline before the bear market in housing is over.
Gold
Earlier this year we discussed the outlook for 2011 based on an “echo analysis” of the Kress cycles. The Kress cycle “echo” effect is a composite of the 6-year, 10-year, 30-year cycles. Using 2011 as the starting point we go back 6 years to 2005, 10 years to 2001 and 30 years to 1981 to arrive at the composite “road map” for the gold market. This provides us with only a rough approximation of what could happen and shouldn’t be used as an absolute guideline since no two markets are ever exactly alike. These cyclical tendencies are worth noting, however, since they do tend to show the same tendencies during the echo years mentioned above.
When we look back at the gold price graphs for the cyclically significant years 2005, 2001 and 1981 what we find is a pattern that more or less repeated in all three years with varying degrees of magnitude. The pattern can be summarized as follows:
A rally followed by a major intermediate-term peak in the first 3-5 months of the year.
A second attempt at a rally followed by a secondary peak in June (usually at a lower level).
A period of weakness in the months of June and July.
A major rally in the August-October period which often resulted in a new high for the year in the gold price.
The August-October rally was the common denominator for all three cyclic periods. This is partly attributable to seasonal trends but also was influenced by a peak in the 6-year cycle in the years 1981 and 2005. The August-October rally in 1981 was especially surprising given the bear market conditions present that year. This composite view of the gold market provides us with a “heads up” on what we can probably expect from now through October.
Gold & Gold Stock Trading Simplified
With the long-term bull market in gold and mining stocks in full swing, there exist several fantastic opportunities for capturing profits and maximizing gains in the precious metals arena. Yet a common complaint is that small-to-medium sized traders have a hard time knowing when to buy and when to take profits. It doesn’t matter when so many pundits dispense conflicting advice in the financial media. This amounts to “analysis into paralysis” and results in the typical investor being unable to “pull the trigger” on a trade when the right time comes to buy.
Not surprisingly, many traders and investors are looking for a reliable and easy-to-follow system for participating in the precious metals bull market. They want a system that allows them to enter without guesswork and one that gets them out at the appropriate time and without any undue risks. They also want a system that automatically takes profits at precise points along the way while adjusting the stop loss continuously so as to lock in gains and minimize potential losses from whipsaws.
In my latest book, “Gold & Gold Stock Trading Simplified,” I remove the mystique behind gold and gold stock trading and reveal a completely simple and reliable system that allows the small-to-mid-size trader to profit from both up and down moves in the mining stock market. It’s the same system that I use each day in the Gold & Silver Stock Report – the same system which has consistently generated profits for my subscribers and has kept them on the correct side of the gold and mining stock market for years. You won’t find a more straight forward and easy-to-follow system that actually works than the one explained in “Gold & Gold Stock Trading Simplified.”
The technical trading system revealed in “Gold & Gold Stock Trading Simplified” by itself is worth its weight in gold. Additionally, the book reveals several useful indicators that will increase your chances of scoring big profits in the mining stock sector. You’ll learn when to use reliable leading indicators for predicting when the mining stocks are about o break out. After all, nothing beats being on the right side of a market move before the move gets underway.
The methods revealed in “Gold & Gold Stock Trading Simplified” are the product of several year’s worth of writing, research and real time market trading/testing. It also contains the benefit of my 14 years worth of experience as a professional in the precious metals and PM mining share sector. The trading techniques discussed in the book have been carefully calibrated to match today’s fast moving and volatile market environment. You won’t find a more timely and useful book than this for capturing profits in today’s gold and gold stock market.
The book is now available for sale at: http://www.clifdroke.com/books/trading_simplified.html
Order today to receive your autographed copy and a FREE 1-month trial subscription to the Gold & Silver Stock Report newsletter. Published twice each week, the newsletter uses the method described in this book for making profitable trades among the actively traded gold mining shares.
By Clif Droke
www.clifdroke.com
Clif Droke is the editor of the daily Gold & Silver Stock Report. Published daily since 2002, the report provides forecasts and analysis of the leading gold, silver, uranium and energy stocks from a short-term technical standpoint. He is also the author of numerous books, including 'How to Read Chart Patterns for Greater Profits.' For more information visit www.clifdroke.com
Clif Droke Archive |
© 2005-2022 http://www.MarketOracle.co.uk - The Market Oracle is a FREE Daily Financial Markets Analysis & Forecasting online publication.